The first plot denoted by Figure-1 shows the minimum bit rate required by using our approach to obtain an error rate of below 0.005, at p=.05 (in blue), p=.06 (in red) and p=.07 (in black). The plot is drawn for probability of occurrences of 0's in the input data ranging from 0.50 to 0.90.
It should be noted that as the probability distribution of 0's and 1's get closer to the equally likely (i.e. 0.50) case, the bit rate needed falls down. This is expected as the distributions closer to the equally likely case turn out to give Huffman- coded bit planes that have probabilities of 0's and 1's closer to 0.50. However, this is not always the case as at the probability of occurence of 0.70, the Huffman code produces bit-planes with either too many 0's compared to 1's (or vice versa), and hence, the bit rate required is very high.
It needs to be noted that the Slepian-Wolf bounds are 0.29, 0.33 and 0.37 for p=0.05, p=0.06 and p=0.07 respectively.
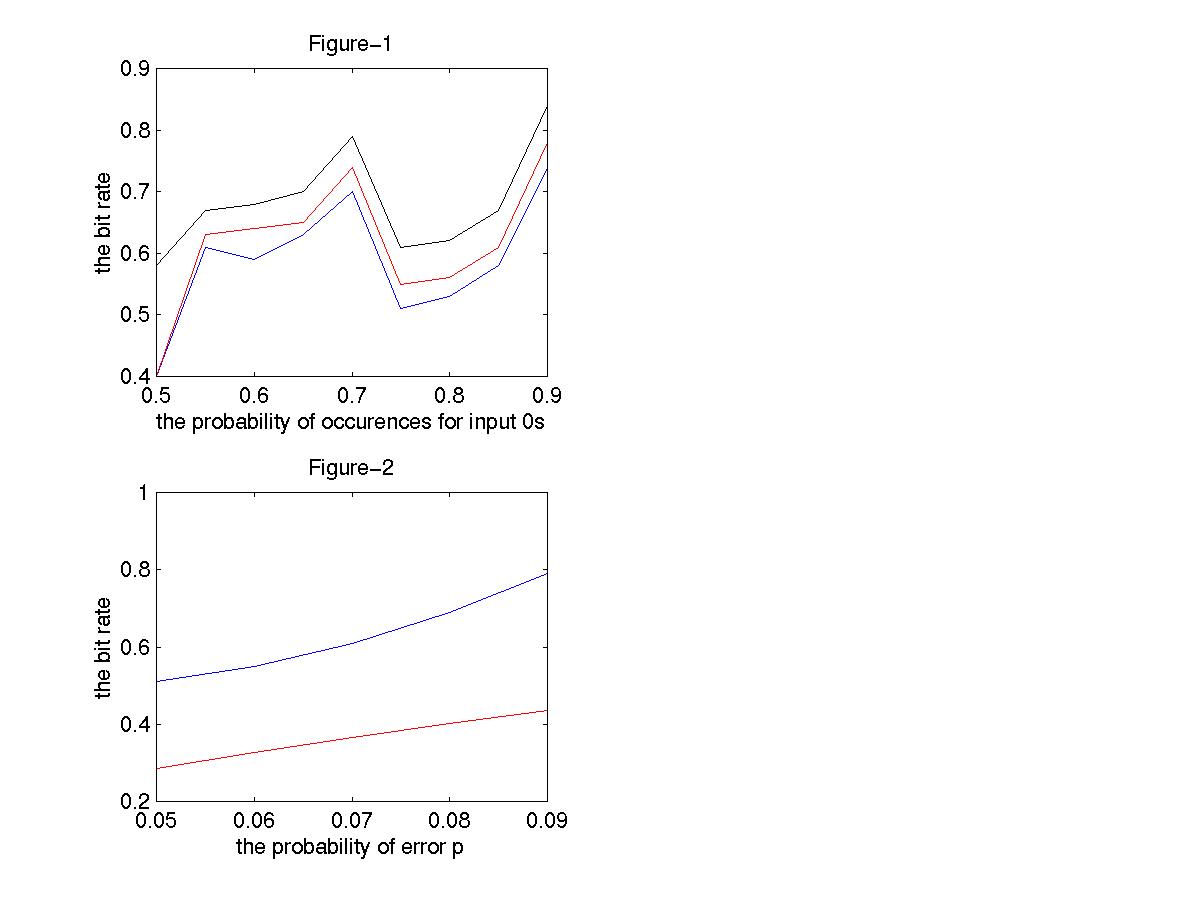
The second plot denoted by Figure-2 shows the minimum bit rates achievable using our approach at the fixed probability of occurences of 0's at 0.75, and for varying p values. This is shown by the blue line. The red line shows the corresponding Slepian-Wolf bounds. It should be noted at for p>0.10, the error makes correct decoding extremely difficult. This is because although the error rate is small (p= 0.10), only:
of the M=4 length Huffman codes are correct. For larger values of p, the ratio of incorrect Huffman codes get even larger, making the use of our approach in the first few bit-planes (which are responsible for most of the bits) very difficult.
ABSTRACT
INTRODUCTION
PRIOR WORK
BASIC SCHEME
METHODOLOGY
RESULTS
CONCLUSIONS
REFERENCES