
Cartilage Thickness Patterns
Measuring cartilage thickness from MR images has become the gold standard for assessing cartilage health. This is usually done by taking average measurements of cartilage thickness over pre-defined regions of the tibial and femoral cartilage. However, in osteoarthritic cartilage, thinning and swelling may occur within the same region, and these focal deteriorations are subject specific, thus drastically reducing the sensitivity of average thickness measurements to detect differences in cartilage health. Our research suggests that analyzing the spatial variations in cartilage thickness increases the ability to detect changes in cartilage due to osteoarthritis (OA).
How cartilage thickness patterns are done
1. MR images are segmented in order to outline the cartilage in consecutive MRI slices. From those tracings, a 3-D model of the cartilage is built and thickness of cartilage covering the bone is calculated. This leads to a 3-D cartilage thickness map (Fig 1).
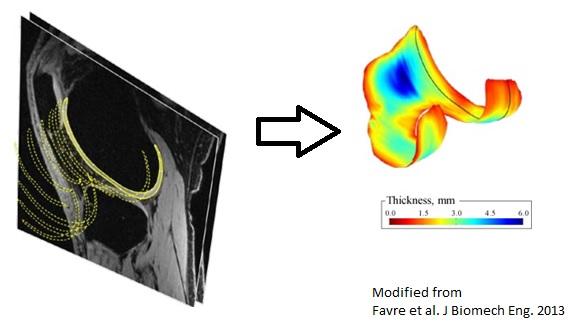 Figure 1: Cartilage segmentation and 3-D thickness maps. |
|
2. To quantify the spatial variation in cartilage thickness, the thickness maps are normalized by the fit of a cylinder (Fig 2). 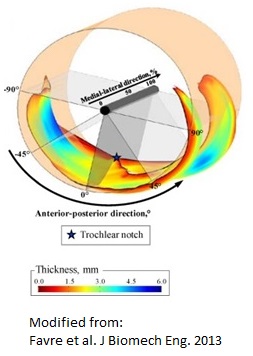 Figure 2: Thickness maps are normalized by being fit to a cylinder. |
3. For each knee six thickness patterns are automatically extracted using a machine learning method previously trained with a large number of knees. The six patterns correspond to the characteristic thickness distribution along the anterior-posterior (AP) and medial-lateral (ML) directions in the trochlear groove and medial and lateral femoral compartments (Fig 3). 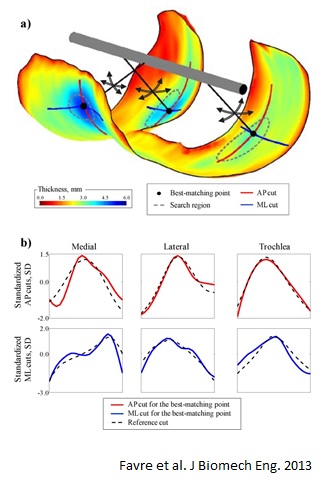 Figure 3: a. Illustration of the automatic extraction of the six thickness patterns in the AP and ML directions of the trochlear groove and medial and lateral femoral compartments. b. Example thickness pattern in each region compared to the reference pattern. |
How to interpret cartilage thickness patterns
Thickness patterns of healthy knees are consistently similar (Fig 4a). On the other hand, degeneration varies regionally in OA cartilage, resulting in thickness patterns different from the typical healthy pattern (Fig 4b). Calculating differences between the typical healthy pattern and the pattern of a given subject (i.e., thickness pattern alterations) allows for the quantification of morphological quality in a much more sensitive way than simply measuring average thickness.
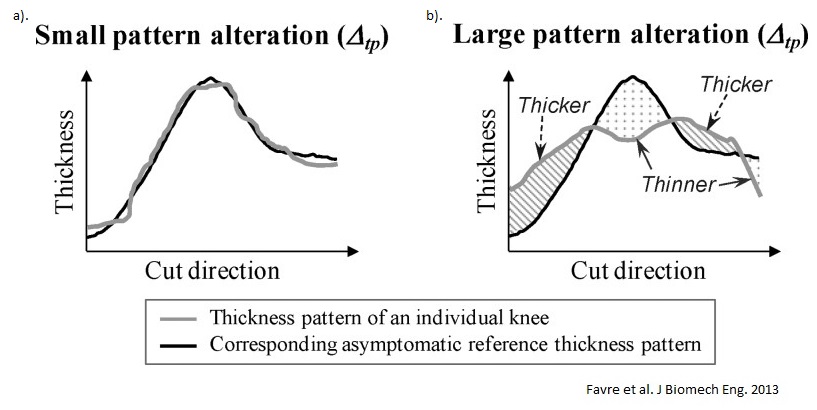 Figure 4: a. An example of a thickness pattern of a healthy knee with small differences from the reference pattern. b. An example of a thickness pattern of an osteoarthritic knee with large differences from the reference pattern. |
Major Findings
- Asymptomatic knees had characteristic regional thickness patterns, which were different in knees with medial OA.
- Thickness pattern alterations increased (i.e. difference relative to the typical healthy thickness pattern becomes bigger) with increasing OA severity.
- Significant differences between tested knees were on average 4.5 times greater using thickness pattern alteration than average thicknesses.
- In the medial compartment, some differences were 10 times greater using thickness pattern alterations than average thicknesses.
- Assessing thickness patterns could be a promising tool for detecting OA-related differences in knees.
Representative Publications:
- Patterns of femoral cartilage thickness are different in asymptomatic and osteoarthritic knees and can be used to detect disease-related differences between samples.
Favre J, Scanlan SF, Erhart-Hledik JC, Blazek K, Andriacchi T. J Biomech Eng. 2013 Oct;135(10):101002-10.