----------
Topics
The goal of the survey
Economic models of investor choice over long horizons
The survey
Analysis of results
Conclusions
-----------
Topic 1
The Goal of the Survey
------------
The Survey
Designed to elicit individual choices under uncertainty
. decisions with long horizons
. focus on a single outcome
.. retirement standard of living
. provide trade-offs based on plausible model of capital market opportunities
Current results preliminary
. small number of participants
. sample may not be adequately representative of investors
--------
Key Questions
Compatibility of responses with a standard model of investor choice
. maximization of expected utility
. utility a power function of wealth
.. Constant Relative Risk Aversion (CRRA)
Two issues
. how many participants make CRRA compatible choices?
. in aggregate, are the responses CRRA compatible?
.. does the "representative investor" maximize a CRRA utility function?
----------
Topic 2
Economic Models of Investor Choice over long horizons
----------
Models of Investor Behavior
Equilibrium models
. based on assumptions about the preferences of the "representative investor"
Financial planning advice
. assumptions about the preferences of each individual investor
---------
Expected Utiity Maximization
An investor's utility is a function of consumption and/or wealth
The investor's goal is to maximize the expected value of utility
-------
CRRA Utility Functions
Assume outcome can be stated as a measure of future wealth (w)
Constant Relative Risk Aversion (CRRA) utility function
. u(w) = w1-l / (1-l )
Marginal utility
. mu(w) = w-l
------------
IID Processes
A return process is independent and identically distributed (IID) if
. the distribution of returns is the same each period
. regardless of the returns in prior periods
-------------
Constant-mix Strategies
If
. joint distribution of returns is IID, and
. an investor maximizes the expected value of a CRRA utility function
Then
. the investor should hold the same proportional values of assets every period
. a constant-mix strategy (CMS)
Therefore
. IID + CRRA ===> CMS
Many financial planners advocate constant-mix strategies for their clients
. thus they may implicitly assume CRRA preferences for every investor
-----------
Lognormal Distributions
The value-relative (1+return) after n periods will equal the product of the n one-period value relatives
Therefore the logarithm of the n-period value relative will equal the sum of the logarithms of the n one-period value relatives
If the return process is IID
. the n-period value relative will approach lognormality as n increases
------------
Binomial IID Processes
Discrete counterpart to standard continuous time model
Two investments
. a riskless bond
. a stock (representing the stock market)
Two states of the world in each period
. in one the stock goes up
. in the other the stock goes down
For a horizon of n periods there will be 2n possible sets of one-period outcomes
. each will have an ending stock value relative
. stock value-relative in ending state s = Ws
---------
State Prices
The Arrow-Debreu Price for a state
. the present cost of obtaining $1 if and only if that state occurs
One-period
. two states
. two prices
n-period outcomes
. 2n states
. 2n prices (but not all different)
. price for $1 in ending state s = Ps
---------
Price/wealth relationships with binomial returns
Define log-linear price/wealth (LLPW) as:
. ln(Ps ) = a + b*ln(Ws )
If returns are binomial IID
. ln(Ps ) = a + b*ln(Ws )
---------------
First-order Condition for Expected Utility Maximization
For every state s
. expected marginal utility of wealth = k*price
If every state is equally probable
. mu(ws ) = k*Ps
for CRRA utility
. mu(ws ) = ws-l
Thus
. Ps = K*(ws-l )
. ln(Ps) = ln(K) - l*ln(ws)
------------
Sufficient Conditions for LLPW Relationship
Stock returns follow a binomial IID process, or
Representative investor has a CRRA utility function
--------------
Properties of Constant-mix Strategies
Constant-mix Strategy
. bond/stock mix constant in percentage terms
. in a continuous process, constant every instant
. in a binomial process, constant every period
Ending value relatives
. lognormally distributed
If stocks are LLPW, for any constant mix strategy
. ln(w) linearly related to ln(P)
. ln(w) linearly related to ln(w) for any other constant mix strategy
----------------
Topic 3
The Survey
----------
Participants
Employees and friends from a financial services firm
. most between 20 and 40 years old
. well educated
. many with degrees in finance or engineering
. many familiar with investing for retirement
Participation solicited for three weeks
Number of participants
. 71 total
.. 66 first-time, 5 repeat
. 66 utilized
Median time to complete survey = 10.7 minutes
----------
Measure of Wealth
Standard of living in retirement
Expressed as a percentage of pre-retirement standard of living
---------
Markers
100
Each represented by a question mark
One is the participant
The participant doesn't know which one represents him or her
Initially, all markers are in a reserve row
The ojective is to place the markers in a pattern in the rows in a playing field
----------
------------
The Budget Constraint
The cost of a pattern
. computed based on set of state prices
. survey cannot be completed unless the cost is between 99%% and 100%% of a fixed budget
The Riskless Alternative
. all markers in the 75%% row
----------
-----------
States of the World
All returns in real terms
100 States
. obtained from discrete approximations of lognormal distributions
.. each state equally probable
.. taken from cumulative distribution at 0.005, 0.015,.. 0.995
Properties of stock value relatives
. 10 year horizon
. all returns in real terms
. riskless rate of interest
.. 2%% per year
. stock returns independent and identically distributed (IID)
. lognormal distribution of stock market value relatives
. one-year stock risk and return
.. expected return = 8%%
.. standard deviation = 18%%
------------
Computing the Set of State Prices
Assume LLPW
Properties of state prices
. ln(P) = a - b*ln(W)
. Ss Ps = 1 / 1.0210
. Ss Ps *Ws = 1
Solve non-linear equation to find a and b
. determines the price for each state
State prices can be used to value any set of payoffs in states
-------------
Determining the Cost of a Distribution
The cost of wealth in state s
. cs = Ps*ws
The total cost of the distribution
. C = Ss cs
Initial budget
. 75 / 1.0210 = 61.52
-------------
Implementing a probability distribution
For each marker
. determine wealth level
. assign to a state
Cost of the assignment
. C = Ss cs
Express as a percent of initial budget
-----------------
Determining a Least-cost Assignment
A distribution will not be least cost if
. payoff in state s < payoff in state s+1 and
. price for state s < price for state s+1
To find the least-cost of a Distribution
. order states from lowest to highest state price
. assign payoffs to states from highest to lowest
Every distribution is assigned to states automatically using this method
. guarantees least-cost
------------
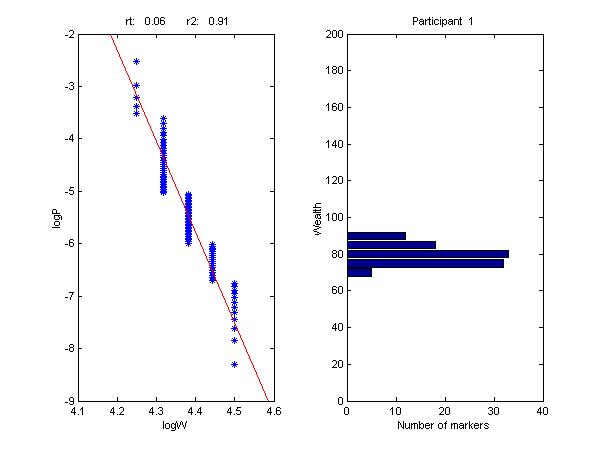
Measuring Conformance with a CRRA Utility Function
Given distribution, assign wealths to states
. based on least-cost
Regress ln(w) on ln(P)
. since P values are given, and participant chooses w values
. result is the best-fit CRRA utility function
Slope coefficient measures risk tolerance (rt)
R-squared (r2) measures degree of conformance to CRRA utility function
. statistical, not necessarily economic
---------
Responses by Participant #1
 --------------------
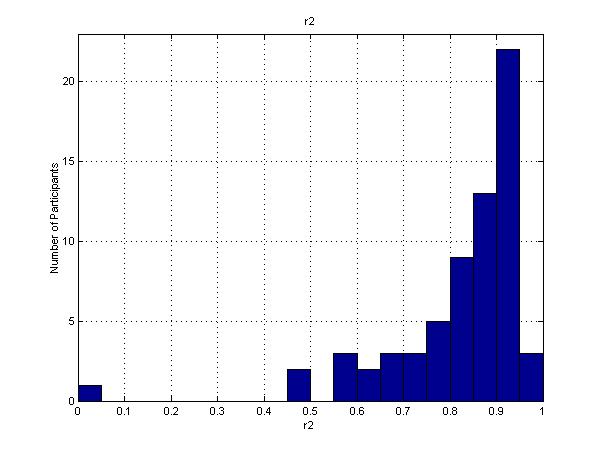
R2 Values for All Participants
--------------------
R2 Values for All Participants
 --------------------
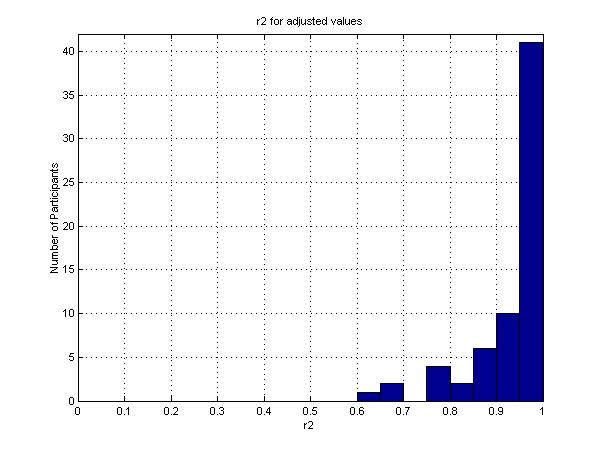
Adjusted Values
Grid for responses is coarse
. 5%%, 10%%, ..., 200%%
Measured r2 value is a lower bound on the r2 value that might be obtained with a finer grid
To find an upper bound
. adjust the wealth in each state towards the regression line
. maximum adjustment = 2.5%%
Fit a new regression line and measure r2
. provides an upper bound
-----------
R2 values for Adjusted Values
--------------------
Adjusted Values
Grid for responses is coarse
. 5%%, 10%%, ..., 200%%
Measured r2 value is a lower bound on the r2 value that might be obtained with a finer grid
To find an upper bound
. adjust the wealth in each state towards the regression line
. maximum adjustment = 2.5%%
Fit a new regression line and measure r2
. provides an upper bound
-----------
R2 values for Adjusted Values
 --------------------
Conformance with CRRA Utility Function
A majority of participants conform reasonably well with CRRA
. for them a constant mix strategy may be appropriate
A significant minority of participants exhibit preferences that do not conform well with CRRA
. for them a dynamic strategy may be preferable
--------------
Finding Comparable Constant Mix Strategies
Estimate risk tolerance from a regression of log(w) on
--------------------
Conformance with CRRA Utility Function
A majority of participants conform reasonably well with CRRA
. for them a constant mix strategy may be appropriate
A significant minority of participants exhibit preferences that do not conform well with CRRA
. for them a dynamic strategy may be preferable
--------------
Finding Comparable Constant Mix Strategies
Estimate risk tolerance from a regression of log(w) on
log(p)
Find combination of bonds and stocks with the same risk tolerance
Result is a comparable constant mix strategy
---------
Constant-mix Strategies for All Participants
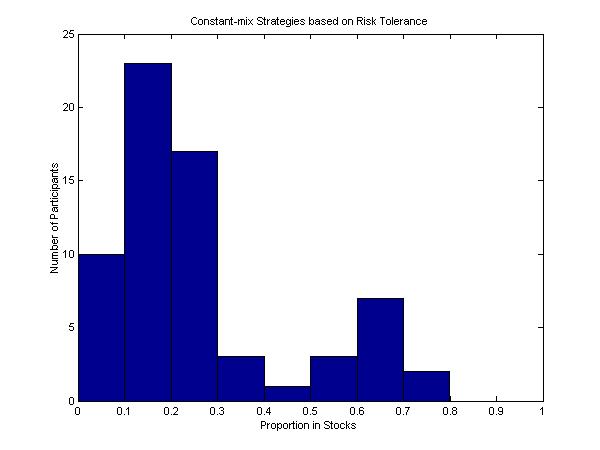 --------------------
Participant Risk Tolerances
All participants are more conservative than an all-stock investor
May be representative of smaller investors
. market portfolio of traded securities approximately 60%% stocks
. retirement standard of living includes lower-risk assets
.. real estate
.. social security
.. money market funds
.. other real assets
------------
Mean/Variance Efficiency
A strategy is mean/variance efficient if no other strategy has
. the same variance and higher mean,
. the same mean and lower variance, or
. higher mean and lower variance
Unless utility is well approximated by a quadratic function of wealth
. some utility-maximizing distributions will not be mean/variance efficient
------------
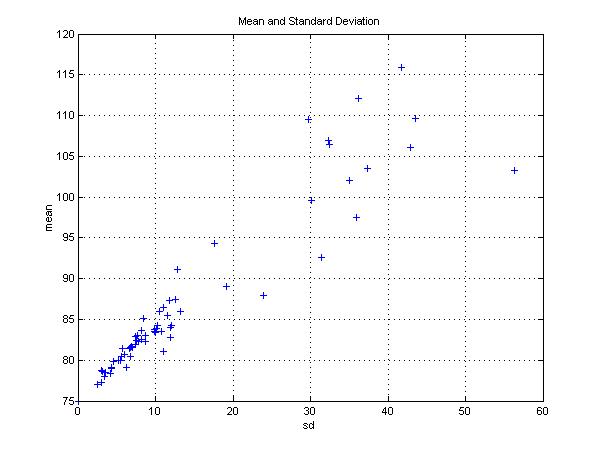
Mean and Standard Deviation
--------------------
Participant Risk Tolerances
All participants are more conservative than an all-stock investor
May be representative of smaller investors
. market portfolio of traded securities approximately 60%% stocks
. retirement standard of living includes lower-risk assets
.. real estate
.. social security
.. money market funds
.. other real assets
------------
Mean/Variance Efficiency
A strategy is mean/variance efficient if no other strategy has
. the same variance and higher mean,
. the same mean and lower variance, or
. higher mean and lower variance
Unless utility is well approximated by a quadratic function of wealth
. some utility-maximizing distributions will not be mean/variance efficient
------------
Mean and Standard Deviation
 --------------------
Mean and Standard Deviation for Adjusted Values
--------------------
Mean and Standard Deviation for Adjusted Values
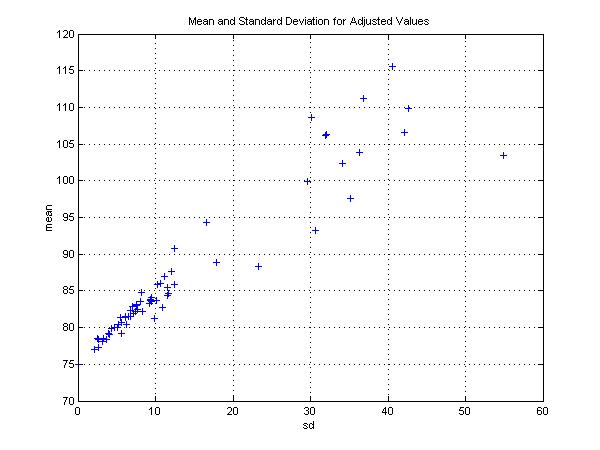 --------------------
Mean/Variance Efficiency of Participant Choices
Participant choices are not all mean/variance efficient in terms of final wealth
. especially true for higher-risk choices
But choices are mean/variance efficient in the short run
. for a binomial process, each period
. for a continuous process, each instant
---------
Preferences of the Representative Investor
Summary data
. aggregate of all markers
Consistency with models of capital markets
. total wealth desired in each state
--------
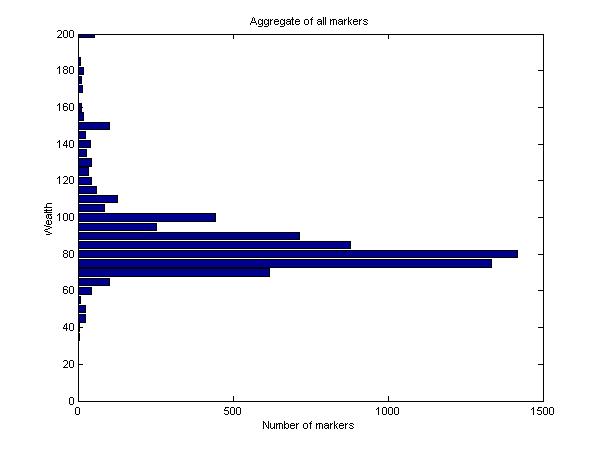
Aggregate of All Markers
--------------------
Mean/Variance Efficiency of Participant Choices
Participant choices are not all mean/variance efficient in terms of final wealth
. especially true for higher-risk choices
But choices are mean/variance efficient in the short run
. for a binomial process, each period
. for a continuous process, each instant
---------
Preferences of the Representative Investor
Summary data
. aggregate of all markers
Consistency with models of capital markets
. total wealth desired in each state
--------
Aggregate of All Markers
 --------------------
Desired ln(w) and ln(P)
--------------------
Desired ln(w) and ln(P)
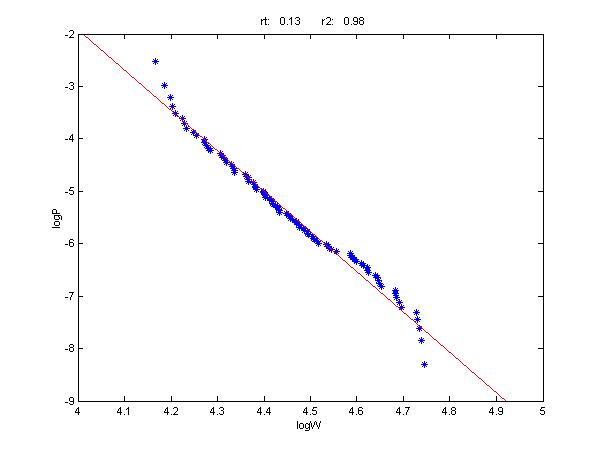 --------------------
Characteristics of the Representative Investor
Relatively conservative
. comparable constant-mix strategy = 26.5%% stocks
Conforms quite well with CRRA utility
. r2 = 0.98
Can be compared with market strategy with 26.5%% stocks
------------
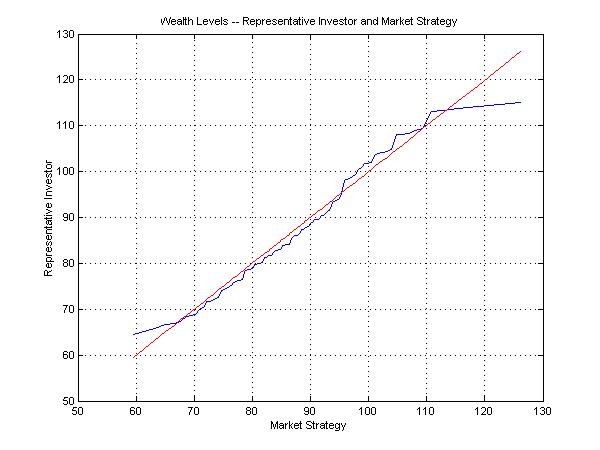
Wealth Levels -- Representative Investor and Market Strategy
--------------------
Characteristics of the Representative Investor
Relatively conservative
. comparable constant-mix strategy = 26.5%% stocks
Conforms quite well with CRRA utility
. r2 = 0.98
Can be compared with market strategy with 26.5%% stocks
------------
Wealth Levels -- Representative Investor and Market Strategy
 --------------------
Deviations from Market Strategy
Probably not significant in terms of preferences
. small sample size
. possible biases
.. reference points from prior experience (70%% as a target standard of living)
Characteristics
. downside protection in severe bear markets
. lower return in moderate bear and bull markets
. higher return in substantial bull markets
. lower return in extreme bull markets
Economic values of differences small
. expressed as percent of initial budget
-------------
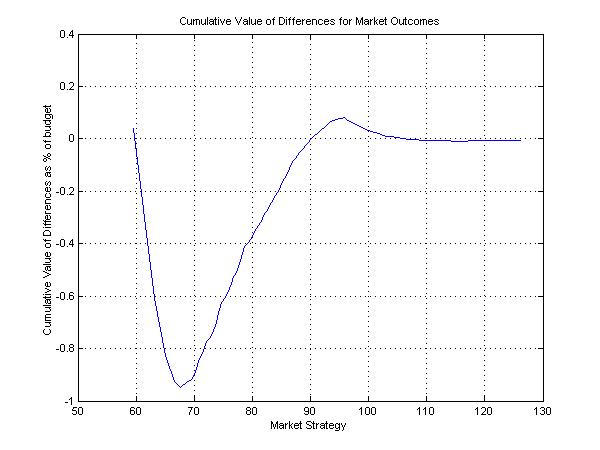
Cumulative Value of Differences by Market Outcome
--------------------
Deviations from Market Strategy
Probably not significant in terms of preferences
. small sample size
. possible biases
.. reference points from prior experience (70%% as a target standard of living)
Characteristics
. downside protection in severe bear markets
. lower return in moderate bear and bull markets
. higher return in substantial bull markets
. lower return in extreme bull markets
Economic values of differences small
. expressed as percent of initial budget
-------------
Cumulative Value of Differences by Market Outcome
 --------------------
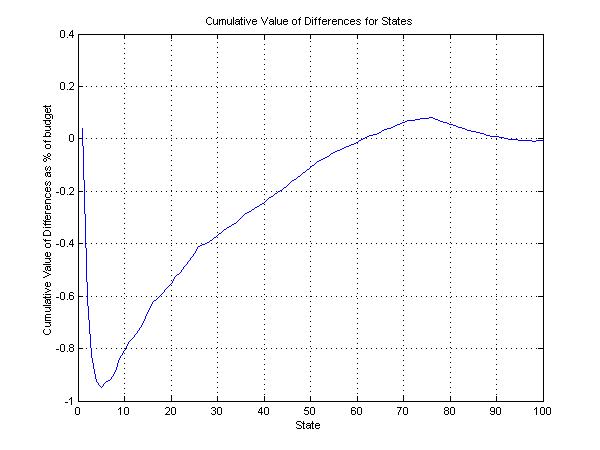
Cumulative Value of Differences by State
--------------------
Cumulative Value of Differences by State
 --------------------
Topic 5
Conclusions
-------------
Conclusions: Aggregate Preferences
Aggregate preferences conform well with standard assumptions
. the representative participant has preferences close to those of an investor with CRRA utility
. the economic value of the differences is less than 1%% of total value
. there is less than a 5%% probability of downside protection
-------------
Conclusions: Individual Preferences
A majority of participants conform reasonably well to standard assumptions
. 25 of 66 had r2 values above 0.90
. 51 of 66 had upper bound r2 values above 0.90
. for them constant mix strategies may be appropriate
A substantial minority of partipants did not conform well with standard assumptions
. for them dynamic strategies may be preferable
. but only if added expected utility exceeds cost
-----------
Conclusions: Overall
All results are highly preliminary
Expanded surveys planned
. larger and more diverse sample size
. after choice made, show comparable constant mix strategy
.. ask participant to indicate %% of budget that would be spent to obtain this distribution
.. would provide an economic measure of the certainty equivalent of the loss in expected utility
. vary riskless alternative among participants
.. would provide evidence of sensitivity of preferences to wealth
More research is needed
==============
--------------------
Topic 5
Conclusions
-------------
Conclusions: Aggregate Preferences
Aggregate preferences conform well with standard assumptions
. the representative participant has preferences close to those of an investor with CRRA utility
. the economic value of the differences is less than 1%% of total value
. there is less than a 5%% probability of downside protection
-------------
Conclusions: Individual Preferences
A majority of participants conform reasonably well to standard assumptions
. 25 of 66 had r2 values above 0.90
. 51 of 66 had upper bound r2 values above 0.90
. for them constant mix strategies may be appropriate
A substantial minority of partipants did not conform well with standard assumptions
. for them dynamic strategies may be preferable
. but only if added expected utility exceeds cost
-----------
Conclusions: Overall
All results are highly preliminary
Expanded surveys planned
. larger and more diverse sample size
. after choice made, show comparable constant mix strategy
.. ask participant to indicate %% of budget that would be spent to obtain this distribution
.. would provide an economic measure of the certainty equivalent of the loss in expected utility
. vary riskless alternative among participants
.. would provide evidence of sensitivity of preferences to wealth
More research is needed
==============