
Photoemission Spectroscopy (ARPES)
Angle Resolved Photoemission Spectroscopy (ARPES) is a valuable tool for probing the electronic structure of materials. Over the past 20 years, with steadily improving momentum and energy resolution, ARPES has provided insights into the physics of many important materials such as the high-Tc superconducting cuprates, colossal magnetoresistive manganites, titanates and most recently, the newly discovered superconducting iron pnictides.
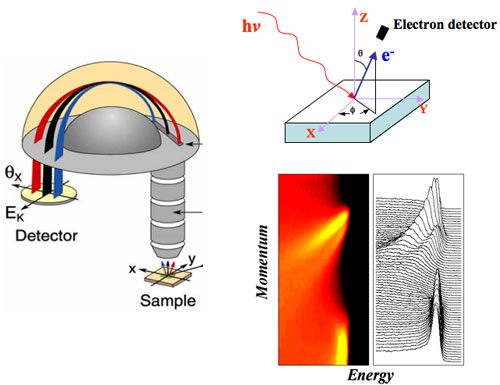
Fig 1: Top right: A cartoon of the photoemission process and experimental setup of a typical ARPES experiments. Left: The geometry of the electron detector showing the energy filtering process. Bottom right: Sample ARPES spectra in energy-momentum space. Bright areas indicate energy and momentum values where high photoelectron flux is observed and correspond to the bandstructure of the material. Taken from the Shen Lab.
ARPES is a photon-in electron-out spectroscopy based on the photoelectric effect. An incoming photon, generated in x-ray sources or laser systems, is directed at a sample where it is absorbed. If the photon supplies sufficient energy to the electron it can overcome the work function and exit the sample as a photoelectron. A movable detector, equiped with an energy filter, captures the photoelectrons in a specific energy range and solid angle. Using conservation of momentum and energy, one can then deduce information about the electron's initial momentum, energy and lifetime and therefore information about the underlying electronic structure. Applying this technique to many body systems, where the electronic structure is not well described by conventional band theory, has provided important insights into many-body physics. Using combinations of numerical and analytical techniques, we have been working to understand the wealth of results coming from this technique through close ties with experimentalists; we presently collaborate with ARPES researchers from UC Berkley and Stanford University.
In the context of the sudden approximation, ARPES data can be interpreted as a direct measure of the single-particle spectral function: A(k,w):
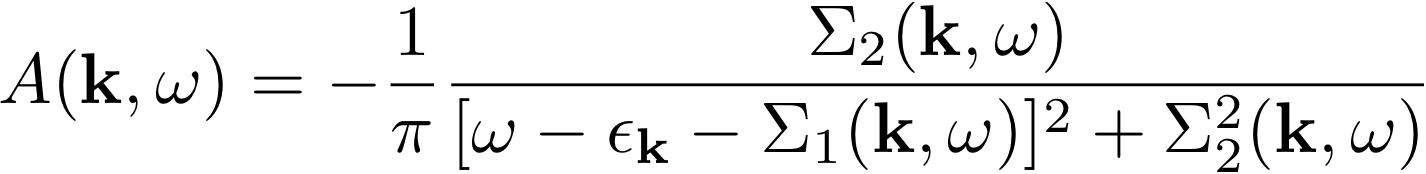
The spectral function is a fundamental quantity in many-body physics that provides energy and
momentum space information about the occupied and unoccupied single-particle states. Here,
A(k,w) has been expressed in terms of a 'self-energy'  (k,w)
which encodes information about how particles are dressed by their interactions with the remainder of the system.
The real part of the self-energy gives the shift of the particles binding energy while the imaginary part is related
to the lifetime of the particle's state. Finally,
(k,w)
which encodes information about how particles are dressed by their interactions with the remainder of the system.
The real part of the self-energy gives the shift of the particles binding energy while the imaginary part is related
to the lifetime of the particle's state. Finally,  (k) is the
bare electronic dispersion of the sample without interactions. We can now look at some examples of ARPES
measured spectral functions.
(k) is the
bare electronic dispersion of the sample without interactions. We can now look at some examples of ARPES
measured spectral functions.
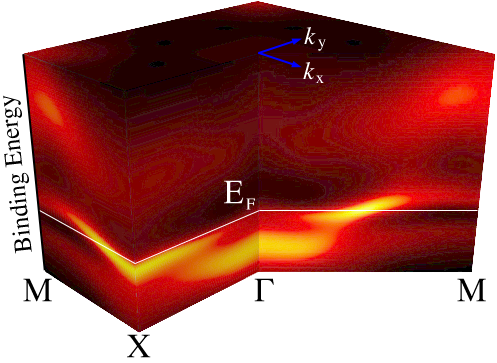
Fig 2: An example of the spectral function A(k,w) for the single-band Hubbard model along high symmetry cuts in the first Brillouin zone. ARPES is sensitive to the spectral function for binding energies only below EF.
Low-Energy Kinks: Electron-Phonon Coupling
Figure 3 presents a series of experimentally measured and theoretical spectral functions near the Fermi level of the double-layer high-Tc superconductor Bi2212 (indicated by the red bars). At low binding energy 'kinks' are readily observed in the bandstructure and these features have been observed in many other cuprates, always with the same universal energy scale. These kinks arise due to coupling between the electrons and a bosonic mode(s) whose identity is of great interest since it is likely playing a key role in the cuprates and may be directly related to the pairing mechanism. The strength of the kink shows a distinct momentum dependence, strengthing as one moves from the nodal to anti-nodal regions of the Brillouin zone.
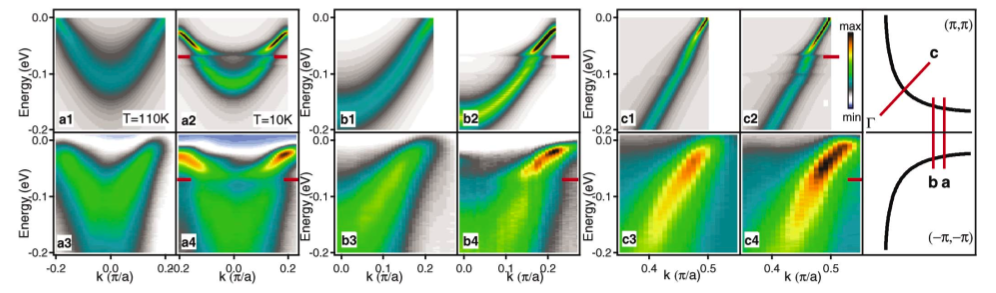
Fig 3: Calculated (upper panels) and measured (lower panels) ARPES spectra for Bi2212 along various directions in momentum space as indicated in the right most panel. For each cut, data for the normal (left) and superconducting (right) states are shown. More information can be found in Reference 2.
Our group has developed a model for these low energy renormalizations in terms of coupling between the electron and a spectrum of bosonic modes. Because of the underlying symmetries of the atomic orbitals of the CuO2 plane and the phonon eigenvectors, the electron-phonon coupling matrix elements have a strong momentum dependence and different modes are being highlighted in different regions of the Brillouin zone. We have also examined the temperature and doping dependence of these features and the evolution of the single-particle self-energies closely matches careful ARPES studies. More information can be found in References 2, 3, 4, 5, and 6.
High-Energy Anomaly or Waterfalls: Electron Correlations
For strongly correlated systems - where the Coulomb interaction is strong and cannot be neglected - the evaluation of the spectral function is complicated by the interactions between the particles. As such, simple approximations that are useful for weakly interacting systems begin to breakdown and new approches must be employed. These strong interactions produce dramatic changes in the spectral function which have been observed in the electronic dispersion of the cuprates at large binding energies; this is the so called 'high-energy anomaly' (HEA) or 'waterfall'.
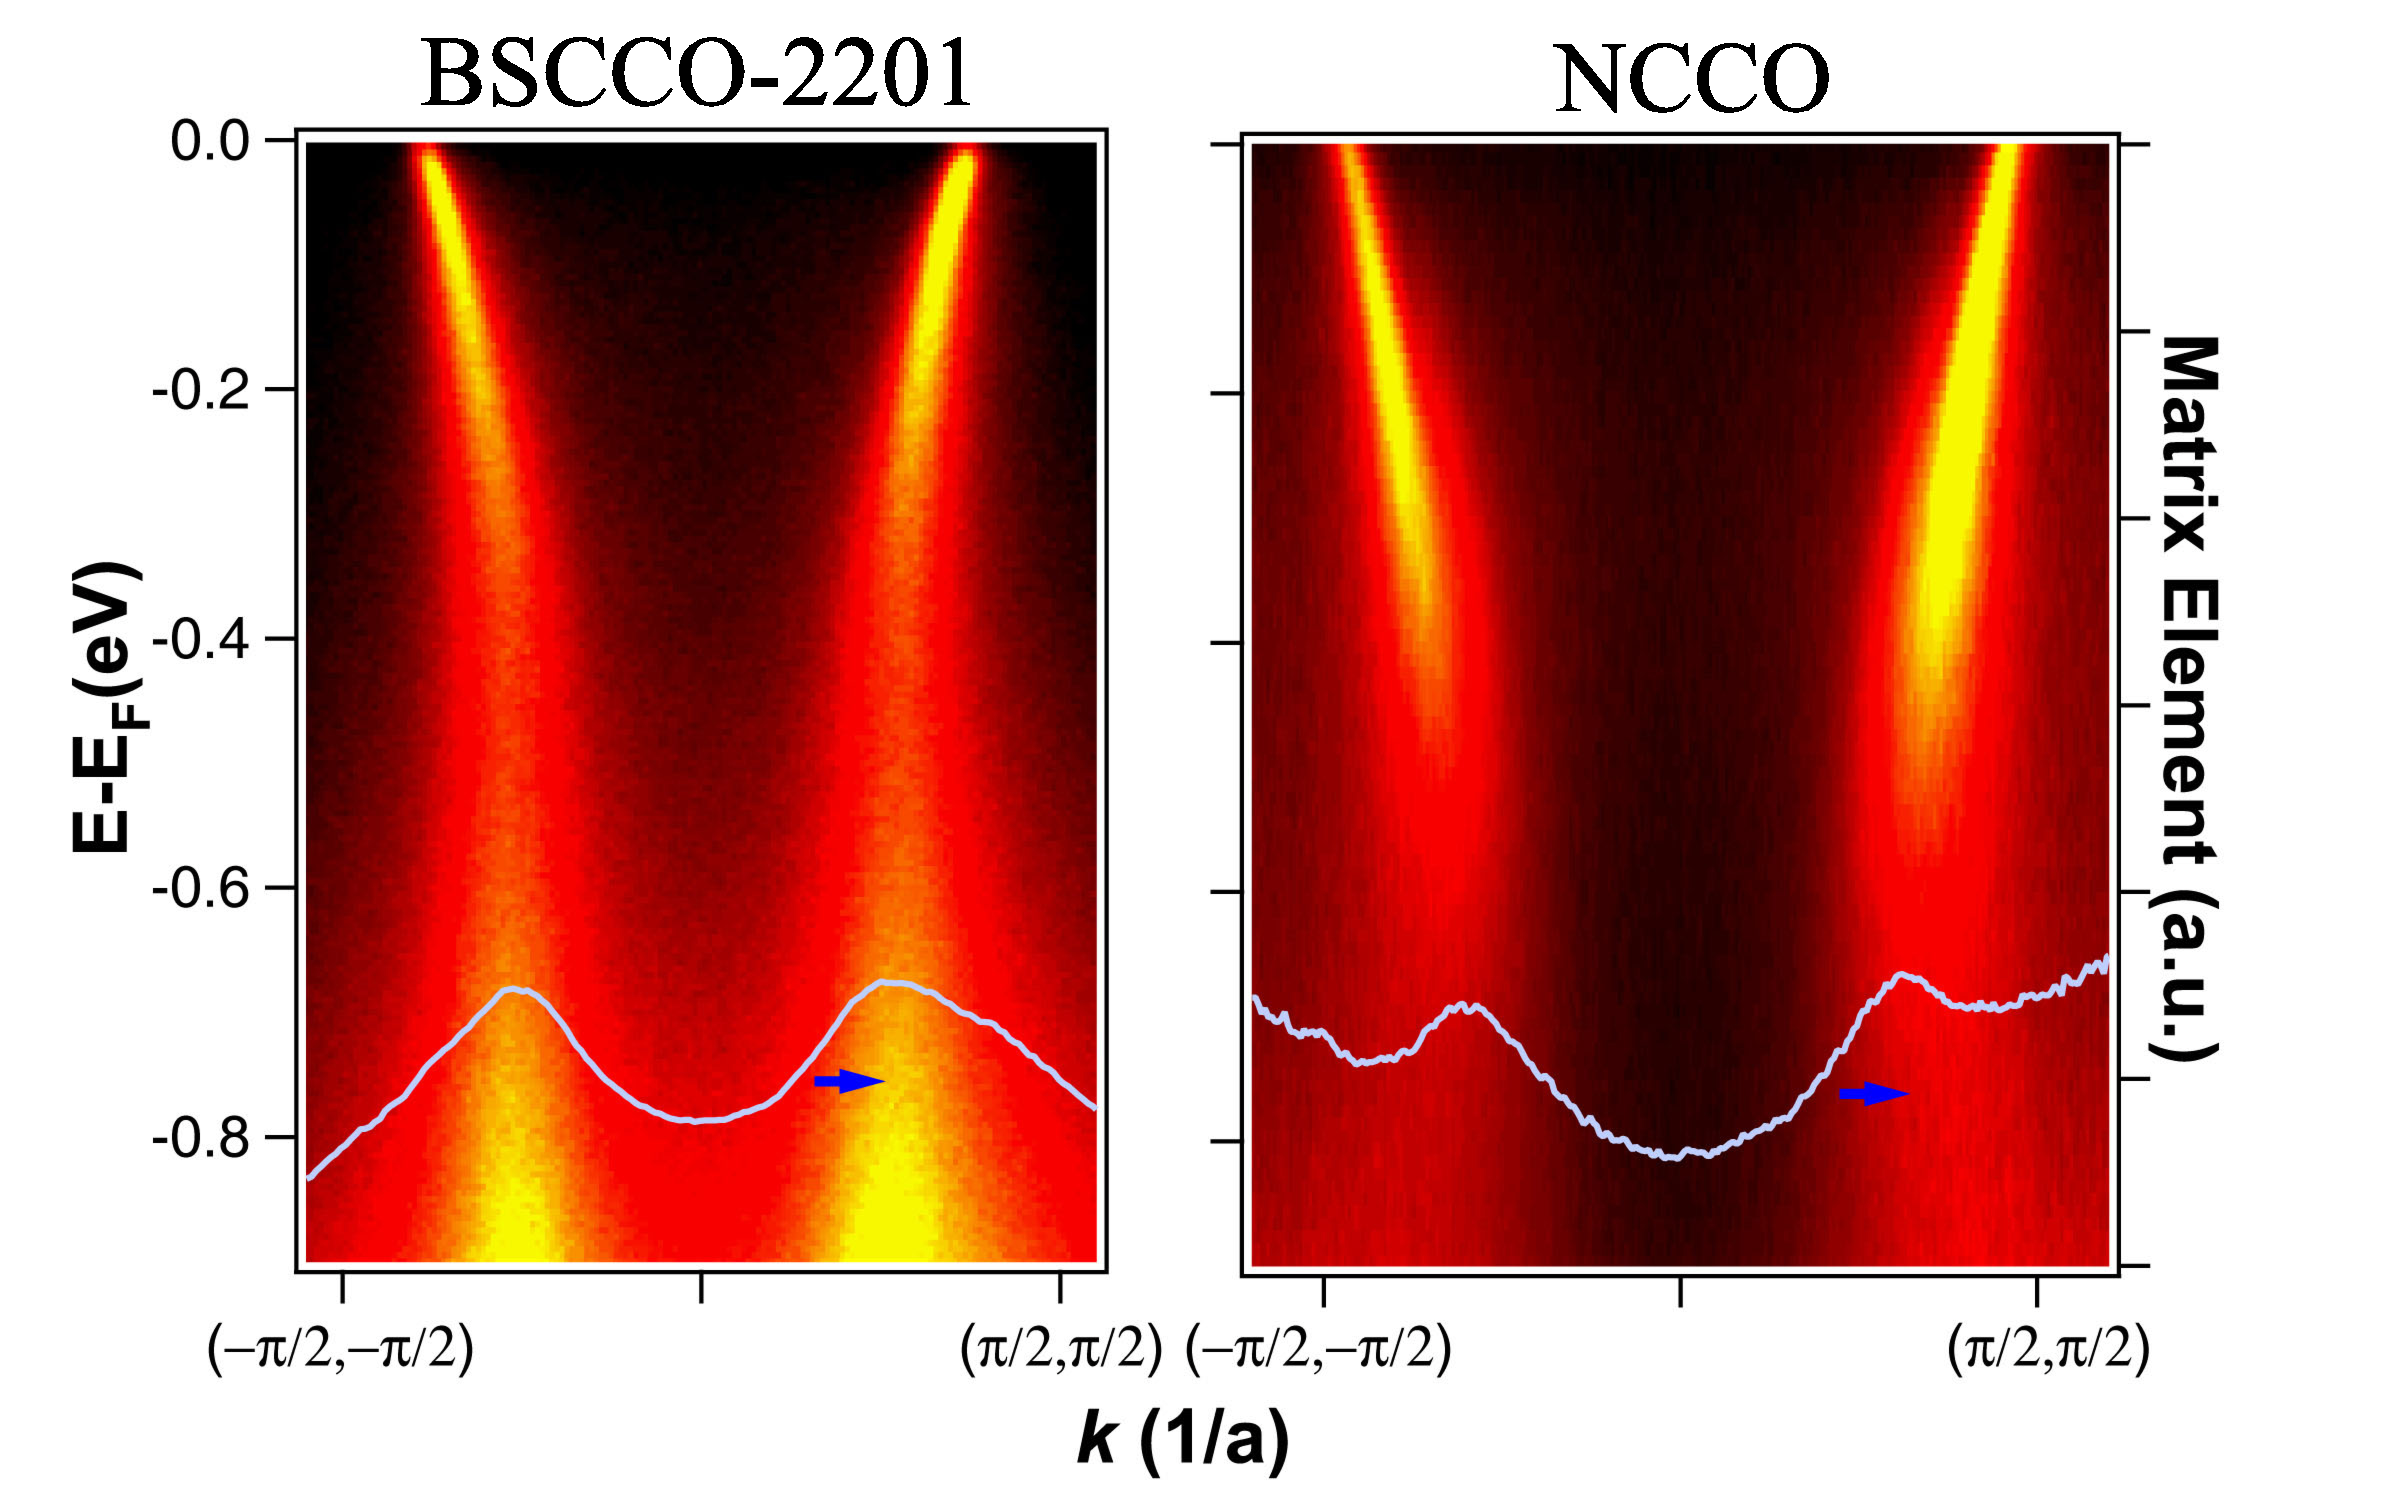
Fig 4: Spectral function along a nodal cut for a hole (left) and electron (right) doped superconductor near optimal doping showing the HEA. Taken from Reference 8.
Using determinant quantum Monte Carlo (DQMC) techniques we have been able to make direct contact with ARPES measurements in the cuprates for both hole- and electron-doped materials as well as the half-filled parent insulators. Below is summary of the calculated spectral functions derived from our simulations for the electron- and hole-doped single-band Hubbard model. Notice the non-trivial renormalization of the electron dispersion leading to the break-up or anomaly/waterfall at intermediate binding energies. These features mirror the results of recent ARPES experiments on doped cuprates.
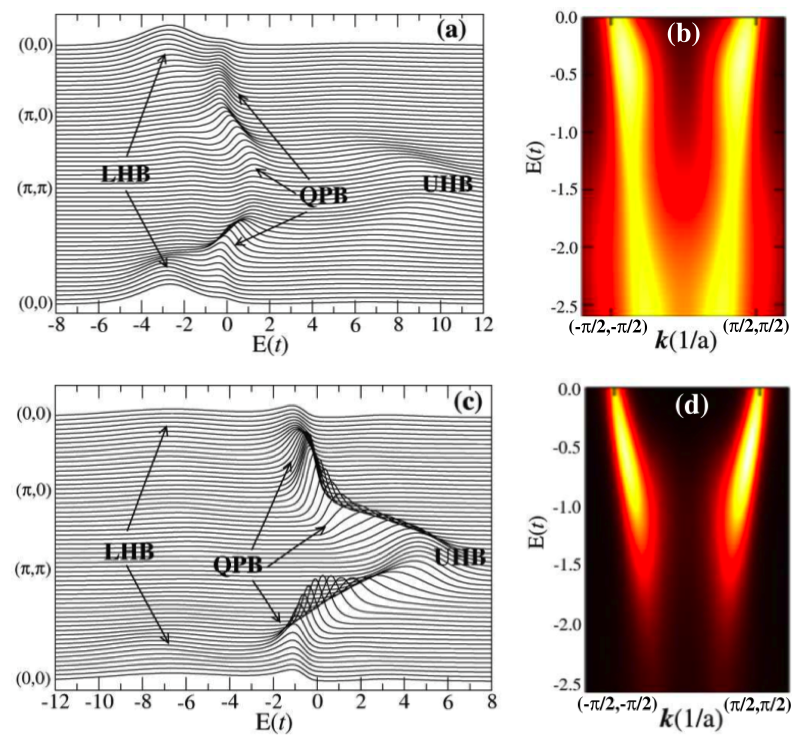
Fig 5: Calculated spectral functions for the 14 percent hole- and 16 percent electron-doped single-band Hubbard model. Determinant quantum Monte Carlo was employed to handle the Hubbard model while maximum entropy methods (MEM) were used to perform the analytic continuation. Further details can be found in Reference 8.
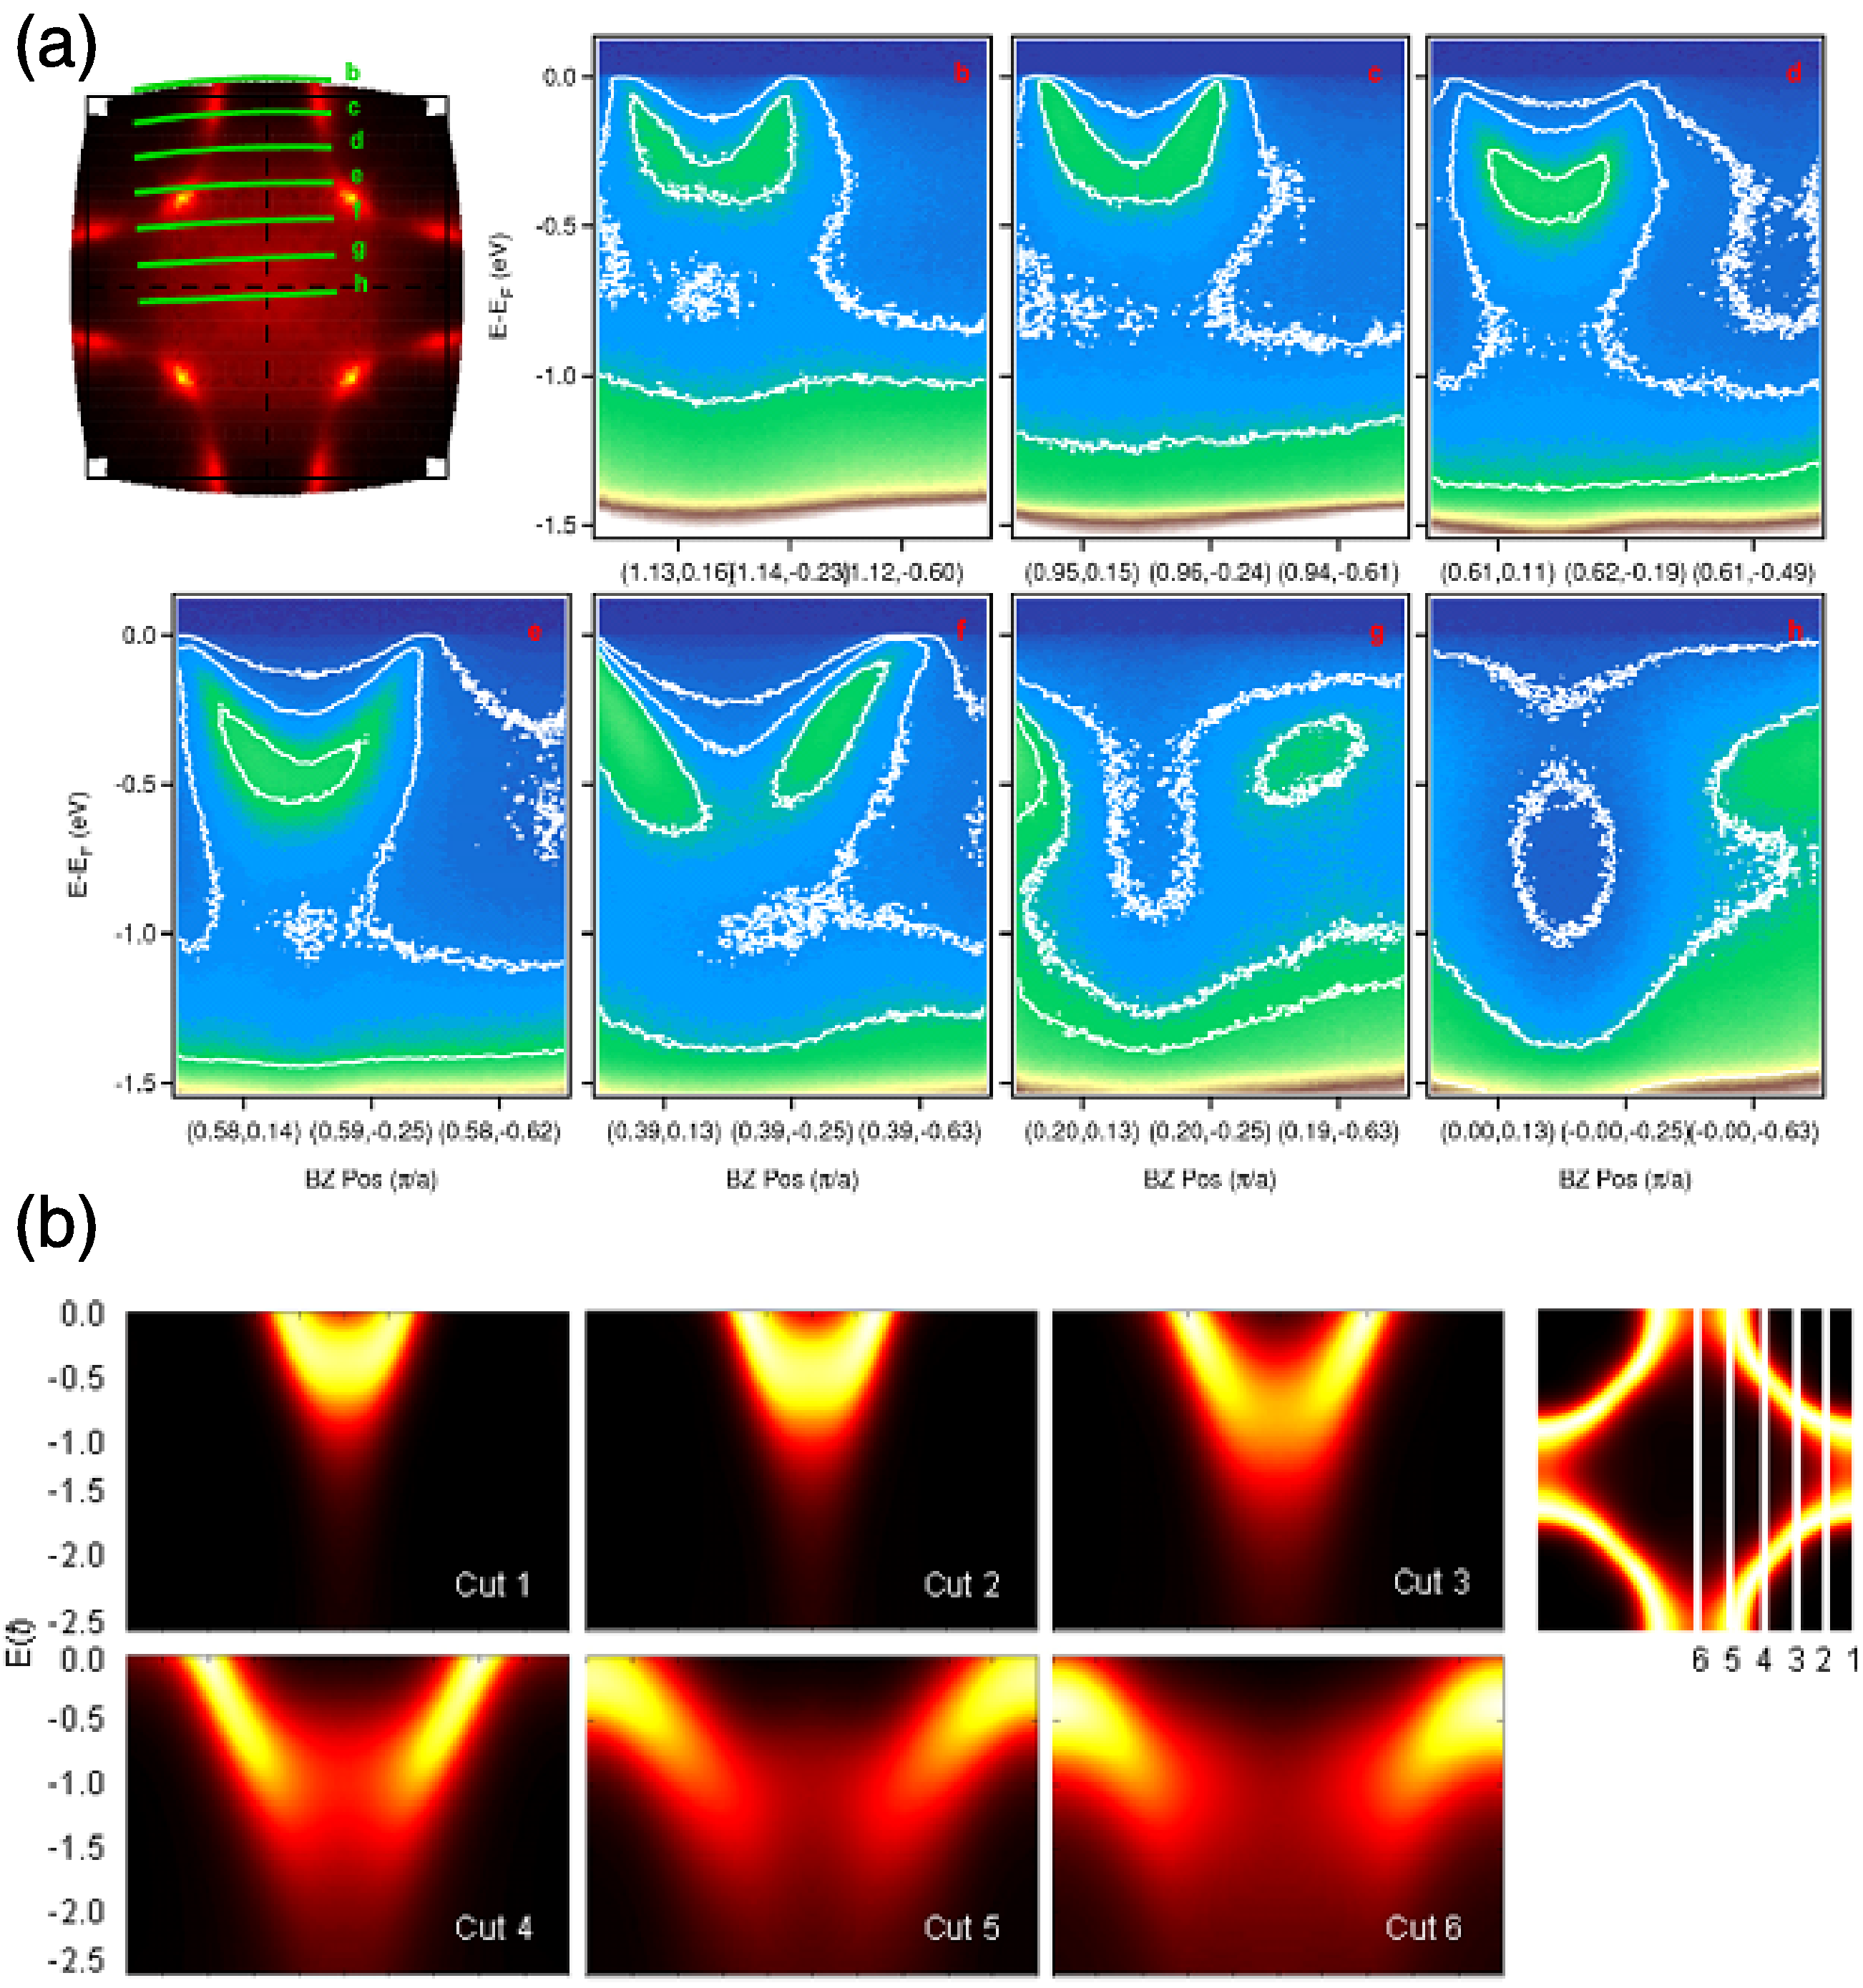
Fig 6: Comparison between experiment and theory along different cuts in the Brillouin zone showing evolution of the HEA as a function of momentum in the electron doped material. Note that no additional ARPES matrix elements have been included in the results from simulation. Adapted from Reference 9.
Iron-based Superconductors: Nematicity and Competing Orders
A new class of unconventional superconductors containing iron recently have been synthesized with families composed of RFeAsO (1111), XFe2As2 (122), and even FeSe (11). Each possess square planes of iron atoms with staggered pnictogen (N/AS-family of elements) or chalcogen (O/S-family of elements) atoms above and below the iron planes. Superconductivity appears in close proximity to a spin-density-wave (SDW) ordered phase and can be tuned with chemical doping or pressure. These compounds also undergo a tetragonal-to-orthorhombic phase transition closely connected to the (SDW) transition. These compounds are playgrounds for investigating the evolution and mechanisms of superconductivity and their interplay with other ordered phases and associated degrees of freedom.
ARPES measurements have been extremely powerful in unravelling the evolution of the electronic degrees of freedom as a function of temperature and chemical doping. ARPES points to precursor nematic fluctuations above the structural and SDW transition temperatures. In addition, it has been used to investigate the competition between the SDW order parameter and superconductivity in a region of coexistence. Nematicity, which is defined as broken rotational symmetry without a corresponding translational symmetry breaking, for example as in traditional liquid crystals, and nematic fluctuations have been reported by neutron scattering, scanning tunneling microscopy, and transport measurements. ARPES measurements reveal an anisotropic splitting above the SDW transition, revealing a large in-plane nematic susceptibility in the electronic structure that manifests in an orbitally dependent manner.

Fig 7: A schematic of the anisotropy in the electronic structure for underdoped Ba(Fe1-xCox)2As2. The tetragonal state (left) possesses C4 rotational symmetry and preserves the degeneracy between orbitals dxz and dyz. Approaching the SDW transition, C4 is broken and the dxz band shifts down and the dyz band shifts up (dashed lines in center). The observed Fermi surface is strongly anisotropic reflecting the new C2 symmetry of the spin and lattice structure (right). Red (blue) pockets indicate hole (electron) character, whereas magenta indicates hybridized pockets from the SDW band-folding. Taken from Reference 10.
We have used a combination of fits to DFT for the low energy bandstructure and weak-coupling, RPA spin fluctuation-based calculations to capture the influence of electron-electron interactions on the electronic phase diagram of the iron-based superconductors. In particular, we have investigated the evolution of the measured electronic structure to tease-out the relative importance of simply the structural transition versus strong nematic fluctuations in driving the observed orbital splitting. We also have used these techniques to develop a phenomenology for the competition between the SDW order parameter and superconductivity. We have been able to replicate the non-monotonic evolution of the observed SDW gap as a function of temperature and provide additional context to the observed band shifts and gap openings as a function of temperature and doping.

Fig 8: (a) Phase diagram of Ba1−xKxFe2As2. (b) Schematic of the expected evolution of the band structure across the structural (TS), SDW (TSDW), and superconducting (TC) transitions. From left to right, the four panels exhibit the band structure in the 2-Fe BZ along Γ-X, starting from the normal state, adding in orbital anisotropy, the SDW folding and a gap, and finally accounting for superconductivity. (c) Measured electronic structure (Fermi surface and band dispersions) in the normal state (left) and SDW state (right), showing the reconstructed Fermi surface in the SDW phase (outline). (d) Band dispersions along the orthogonal AFM and FM directions in the SDW phase, signalling the electronic nematicity. Taken from Reference 11.
Cuprate Phase Competition
In the high-temperature (Tc) cuprate superconductors, a growing body of evidence suggests that the pseudogap phase, existing below a characteristic temperature, typically denoted T∗, may be characterized by one or more broken electronic symmetries, which would be distinct from superconductivity. This evidence comes primarily from NMR and recent x-ray and neutron scattering experiments, suggesting competing charge and/or spin order. However, unlike the iron-based superconductors, no direct link has been made to this competition from the evolution of the low-energy excitations. In particular, no "singular" behavior, or abrupt change in the electronic structure, has been observed in ARPES upon traversing the region of the pseudogap or across the superconducting transition temperature.
This changed recently with the careful and systematic study of the evolution of the spectral features, particularly in the anti-nodal region, as a function of both chemical doping and temperature. The ARPES measurements reveal an antagonistic singularity crossing the superconducting transition at Tc. This manifests itself for Bi2Sr2CaCu2O8+δ in both the low and high binding energy spectral weights, as well as the first moment of the spectrum, as a function of temperature with a decreasing singular behavior with increased doping, or "weakened" pseudogap. This behavior, and its temperature and doping dependence provide compelling evidence for phase competition, which persists up to a relatively large doping level (hole concentration of p ~ 0.22).

Fig 9: (a) Fermi-Dirac-divided spectra as a function of temperature at the anti-nodal point for an optimally (OP) doped sample with a Tc of 98 K. (b) Schematic Fermi surface. (c) Peak, dip, and hump energies as a function of temperature. The peak, dip, and hump are defined as the local maximum, local minimum, and local maximum, respectively, with increasing binding energy. (d)–(f) The first moment calculated in the range [0, 0.25] eV and normalized spectral weights in the ranges [0, 0.07] and [0.20, 0.25] eV, respectively. The dashed red line indicates Tc, clearly showing a singular in the temperature evolution of the spectral function. Taken from Reference 12.
A phenomenological model can be used to study the evolution of these spectral features. Our model includes ingredients that will lead to suppression of spectral weight in the normal state through a fluctuating density wave (either charge or spin). This mimics the influence of the pseudogap and may be connected to its origins. This fluctuating order competes with superconductivity in a very simple way that can be derived from a Ginzburg-Landau-like form for the free energy. In addition, we include coupling to a bosonic (phonon) mode at ~ 40 meV to reproduce the peak-dip-hump structure seen in experiment. While there are a number of parameters that can be tuned to produce consistent results, the comparison between the experiments and calculations confirms that the singularity is a signature of competition between the order parameters for the pseudogap and superconductivity and highlights the importance of bosonic mode coupling in producing consistent spectral features with both temperature and doping. The observation of the spectroscopic singularity at finite temperatures over a wide doping range provides new insights into the nature of the competitive interplay between orders and the complex phase diagram near the pseudogap critical point in the cuprates.

Fig 10: (a) Spectra across Tc with coupling to a bosonic mode. (b) Peak, dip, and hump energies extracted from the spectra in (a) to compare with the experimental measurements. (c) Pseudogap (PG) and superconducting (SC) order parameters taken in competition with one another. The explicit temperature evolution of the order parameters has been taken to provide the best comparison with experiments and mimics the temperature dependence of the charge scattering Bragg peak from x-ray measurements. (d)–(f) First moment in the range [0, 0.25] eV and the normalized spectral weights in the ranges [0, 0.07] and [0.20, 0.25] eV, respectively, consistent with the experimental findings. Filled markers indicate data taken including coupling to a bosonic mode with open markers indicating data taken from spectra without bosonic mode coupling [as in (g)]. (g) Spectra across Tc without bosonic mode coupling. Taken from Reference 12.
References and Further Reading
- A. Damascelli, Z. Hussain, and Z.-X. Shen, Rev. Mod. Phys. 75, 473-541 (2003).
- T. Cuk et al, Phys. Rev. Lett. 93, 117003 (2004).
- T. P. Devereaux et al, Phys. Rev. Lett. 93, 117004 (2004).
- T. Cuk et al, Phys. Stat. Sol. (b) 242, No. 1, 11-29 (2005).
- W. S. Lee et al, Phys. Rev. B 75, 195116 (2007).
- W. S. Lee et al, Phys. Rev. B 77, 140504(R) (2008).
- W. Meevasana et al, Phys. Rev. B 75, 174506 (2007).
- B. Moritz et al, New J. Phys. 11, 093020 (2009).
- F. Schmitt et al, Phys. Rev. B 83, 195123 (2011).
- M. Yi et al, Proc. Nat. Acad. Sci. 108, 6878-6883 (2011).
- M. Yi et al, Nature Comm. 5, 3711 (2014).
- M. Hashimoto et al, Nature Mater. 14, 37-42 (2015).


")
")
")
")
")
")
")
")
")
")
")
")
")
")
")
")
")
")
")
")
")
")
")
")
")
")
")
")
")
")
")
")
")
")
")
")
")
")
")
")
")
")
")
")
")
")
")
")
")
")
")
")
")
")
")
")
")
 (2017)")
")
")
")
")
")
")
")
")
")
")
")
")
")
")
")
")
")
")
")
")
")
")
")
")
")
")

