Research
The links will take you to internal pages about the the Devereaux Group research concentrations.
Scanning Tunneling Microscopy
Scanning Tunneling Microscopy (STM) is an experimental technique used to probe the physical surface and electronic structure of materials. In a typical STM experiment, a metallic tip is held a distance above the sample in high vacuum and a bias voltage is applied across the tip-vacuum-sample interface. This results in a tunneling current into or out of the sample that is proportional to the convolution of the density of states (DOS) of the tip and the sample. For a metallic tip the DOS is constant and so the current-voltage (I-V) curve's derivative is directly proportional to the DOS of the sample (multiplied by the relevant tunneling matrix elements). The point-like nature of the tip allows STM to probe the sample with atomic precision and the technique provides real-space information about the electronic structure of the sample.
Energy Scales
STM has a long standing history in the study of superconductivity; it was STM which ultimately verified that phonons were the underlying coupling mechanism in conventional superconductors when McMillian and Rowell were able link fine structure in the DOS of lead to its spectrum of phonon modes measured by neutron scattering. This cemented the community's consensus that phonons were responsible for superconductivity. In a conventional superconductor the phonons mediate the formation of the gap and renormalize the underlying bandstructure. This results in changes to the electronic density of states and the interplay between the two effects produces shoulders in the DOS at energies set by peaks in the phonon density of states, shifted by the energy of the superconducting gap. This case is illustrated in the left side of Fig. 2.

Fig 1: A comparison of the energy scales measured by STM in conventional and high-Tc superconductors. Top Left: The phonon modulated DOS of lead. Bottom Left: The effective phonon spectral density for lead. Peaks in the phonon DOS correspond to shoulder features in the electron DOS due to el-ph coupling. Top Right: The DOS and its first derivative in Bi2212. The arrows indicate the position of shoulder features. Bottom Right: The distribution of energy scales extracted from the shoulder position. A clear oxygen isotope shift is observed.
More recent STM experiments on the double layer cuprate Bi2212 have found similar structures in its DOS. In this case, the feature is found at a fixed energy scale offset from the superconducting gap and shows a distinct oxygen isotope shift, hinting at the role of the lattice. However, when an energy scale is extracted from the data it shows an inverse correlation with the magnitue of the superconducting gap, which is contrary to the expectations of BCS theory. We have been working to understand these features by calculating the DOS with models we have developed in the context of the band renormalizations observed in ARPES.
Local Inhomogeneity and Dopants
Tunneling experiments also observe local inhomogeneity in the electronic structure of cuprates, both in the normal and superconducting states. This inhomogeneity has been interpreted as local modulations in the pairing strength. Empricially, it has also been directly correlated with dopant impurities such as interstitial oxygen. In a recent work we have studied the role of an oxygen dopant in Bi2212 in order to gain a quantitiative microscopic understanding of how such an impurity can give rise to inhomogeneity.

Fig 2: A summary of the effect of an oxygen dopant in an ideal Bi2212 crystal. (a) The crystal structure of Bi2212 and the position of an oxygen dopant atom. (b)-(d) the Madelung (cohesive) energy of the apical oxygen, planar oxygen and planar copper as a function of distance to the dopant atom. (e) The local variation of the charge transfer energy and (f) the corresponding local variation in exchange energy J due to the presense of the dopant. Panel (g) shows the dependence of the results for J when different charge distributions are assumed.
To model the effect of the dopant we performed electrostatic Ewald sums on the doped lattice in order to determine the local variation in the Madelung (or cohesive) energy of the crystal. This in turn allows us to calculate quantities such as the charge transfer energy, or energy cost associated with moving a hole from a ligand oxygen to the copper site, or antiferromagnetic exchange interaction strength J. Both of these quantities are important building blocks for models of high-Tc superconductivity and our results are summarized in Fig 2.
Our results show that the presense of the dopant locally modulates J by about twenty percent. These results have been confirmed using the non-perturbative technique of exact diagonalization on small CuO2 clusters. However, the bare charge of the dopant also affects the local electric field strengths, which has an influence on coupling to c-axis phonons in the system. When coupling to the phonons is included in our cluster calculations we find a sizable change in the exchange interaction. This implies a strong entanglement of the electronic and lattice degrees of freedom.
Quasiparticle Interference
The real-space nature of an STM probe allows it to provide complementary information to momentum-resolved photon probes such as ARPES. However, the technique of Fourier Transform STM (FT-STM) has recently been developed, where momentum-space properties of a material are inferred from Fourier transforming its real space image. This technique has proved useful in studying the momentum-space structure of the high-Tc cuprate superconductors.

Fig 3: Schematic diagram of the QPI q-vectors from the octet model.
The elementary excitations of a superconductor are called ''Bogoliubov quasiparticles,'' which are a linear combination of an electron and a hole in opposite spin and momentum states. When quasiparticles scatter off of impurities in a material, their momentum-space eigenstates are mixed, which results in quasiparticle interference (QPI). This QPI produces a modulation of the material's real space density of states (DOS) and is hence detectable with STM. If Fourier transformed to momentum space, the modulation shows up as a set of peaks, which are interpreted according to the octet model. In this model, the maximum quasiparticle DOS occurs at the ends of ''banana shaped'' contours of constant quasiparticle energy that appear around the normal state Fermi surface. Due to the large joint DOS between the ends of these contours, quasiparticle scattering is dominated by seven momentum space vectors (q1, ..., q7) that connect the ends of these contours. FT-STM can be used to measure these q-vectors, and how they evolve with changing bias energy.
As bias energy is increased, some of the q-vectors grow, while others are suppressed upon crossing the antiferromagnetic zone boundary. The behavior of the various q-vectors can be explained by studying the momentum dependence of impurity scattering. This momentum dependence affects some q-vectors differently than others, because different vectors connect different parts of the Fermi surface. For example, some q-vectors connect Fermi surface locations where the phase of the superconducting gaps are equal, whereas others connect points of opposite phase.
We are performing calculations to compare to FT-STM data in order to study how the momentum dependence of the impurity scattering affects the various q-vectors, and compare the FT-STM results to data taken with ARPES. We are considering different types of scattering, for example, scatterers that modify the electron hopping parameter or the superconducting gap.
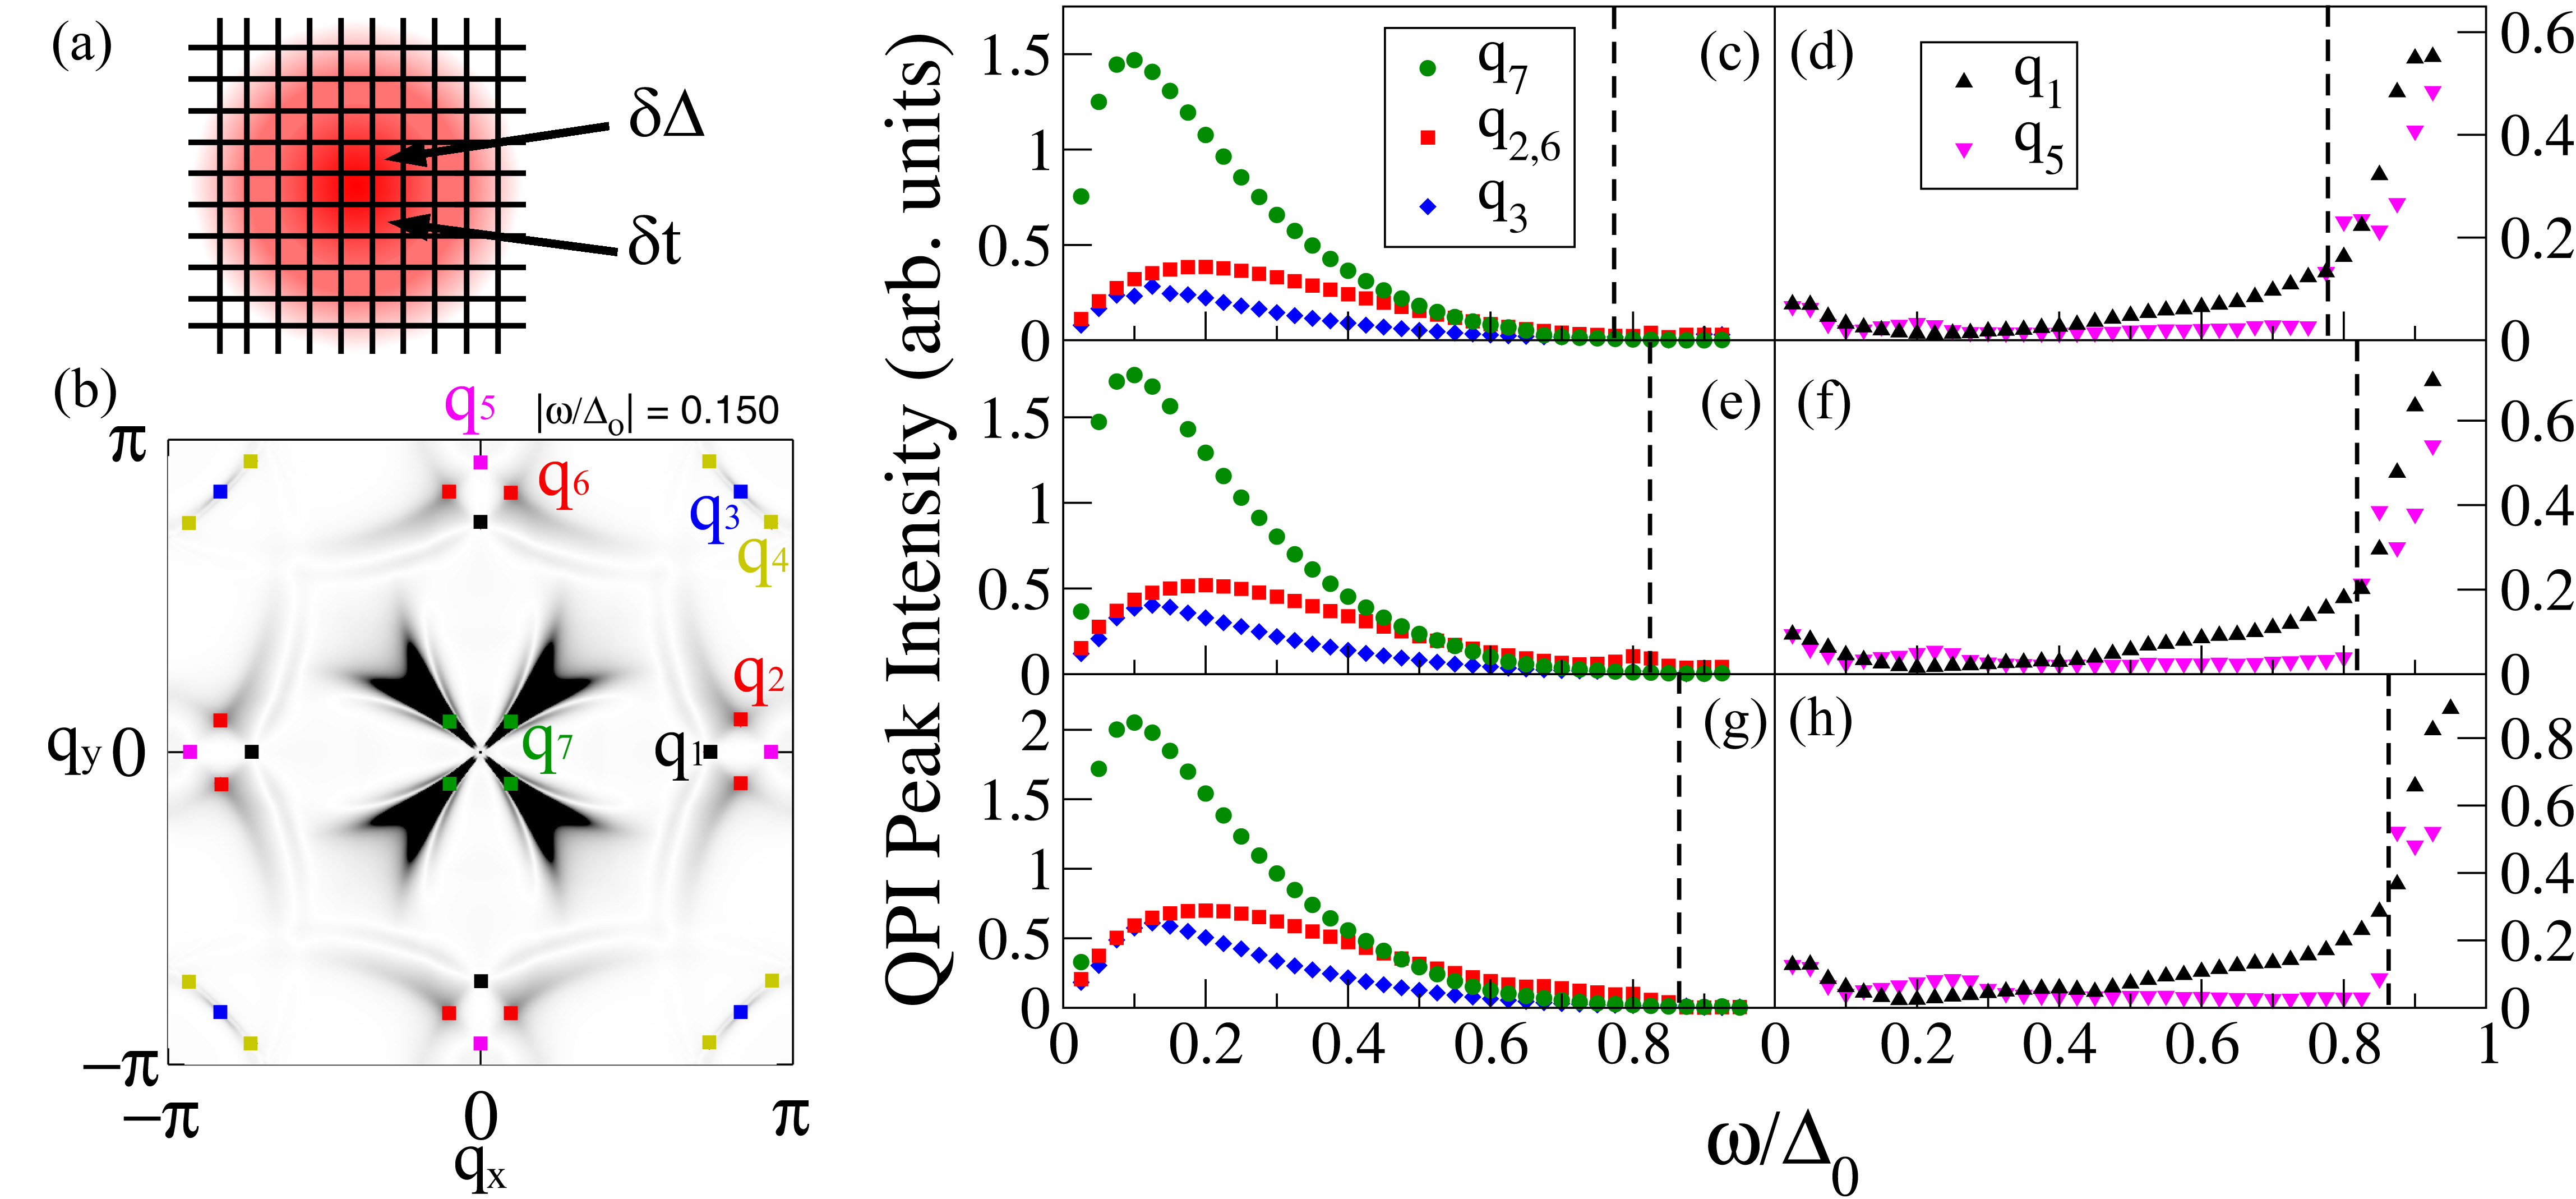
Fig 4: (a) Sketch of the patch used for calculations. (b) Z map for |ω/Δ0|=0.15. The QPI wave vectors q1 - q7 are indicated. (c)-(h) QPI peak intensities determined from the Z map for 5% (c,d), 10%(e,f) and 15% (g,h) hole doping. (c),(e) and (g) show the intensity for wave vectors q7, q2,6 and q3. The dashed line in each panel indicates the energy where the tips of the CCEs cross the antiferromagnetic zone boundary, where the peak intensities associated with q2,3,6,7 vanish. (d),(f) and (h) show the intensities for wave vectors q1 and q5, which rise on approaching the antiferromagnetic zone boundary. From Reference 5.
One can suppress error due to tip alignment inaccuracies in STM experiments by studying Z-maps of the DOS, which is defined as the ratio of the DOS at positive bias to the DOS at negative bias. We also utilize a Z-map in order to make a meaningful comparison between our calculations and experiment. A movie of a Fourier transformed Z-map from our calculations is shown below. It shows the evolution of the Z-map and the corresponding peaks associated with each of the q-vectors as a function of applied bias voltage.

Fig 5: Animation showing the evolution of the Z-map intensity as a function of frequency in comparison with the plots in Fig. 4.
References and Suggested Reading
- Ø Fischer et al, Rev. Mod. Phys. 79, 353-419 (2007).
- J. Lee et al, Nature 442, 546 (2006).
- S. Johnston, F. Vernay, and T. P. Devereaux, Europhys. Lett. 86, 37007 (2009).
- Kohsaka et al, Science 315, 1380-1385 (2007).
- I. Vishik et al, Nature Physics 5, 718 - 721 (2009).
J. C. Davis Group
Yazdani Lab
Hoffman Lab