Stanford University
Professor of Education and Learning Sciences
roy.pea@stanford.edu
 WorldWatcher (1996-ongoing)
Released in 1996 as part of the CoVis Project, WorldWatcher
is a scientific visualization environment for supporting student inquiries
in a broad range of scientific disciplines. WorldWatcher was a collaborative
effort led by Daniel Edelson, now Associate Professor at Northwestern University,
and building on several other CoVis visualization tools that were created
with graduate students Douglas Gordin and Joseph Polman (for a design research
history, see Edelson, D. C., Gordin, D.N., & Pea, R. D. (1999). Addressing
the challenges of inquiry-based learning through technology and curriculum
design. Journal of the Learning Sciences, 8(3&4), 391-450.
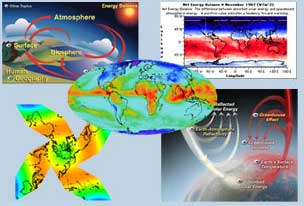
WorldWatcher, used with a Global Warming curriculum, now provides an accessible and supportive environment for students to explore, create, and analyze scientific data. It was designed to give students access to the same features found in the powerful visualization environments that scientists use, while providing students with the support they need to learn through the tools. WorldWatcher contains global climate and climate change data for analysis and visualization. This data is supplemented with human and physical geography data that allow students to examine the causes and implications of climate change. The datasets are drawn from a variety of NASA and other public domain sources. Data currently available in WorldWatcher include long-wave radiation, surface temperature, reflected solar energy, and net energy balance. Global climate data, such as precipitation and relative humidity, are available. Physical data include vegetation, ground cover, plant energy absorption, and soil type. Students can also access global information on population magnitude and density, carbon emissions, and political boundaries.
WorldWatcher can render data in schematic and diagram form. This helps students actually see the relationship between, say, incoming solar energy and earth-atmosphere reflectivity. They can also create their own diagrams as they develop new datasets. All graphic displays can be annotated and the annotations collected in a notebook. The notebook supports text, multimedia, and "hot" links to specific visualizations. They help students create projects and record their progress during the unit. WorldWatcher’s interpretive capabilities—like those in visualization environments for professional researchers—help students place data in context. Latitude and longitude coordinates, country or state designations, and constantly updated data values help students keep track of the data they are working with at any given time. WorldWatcher also allows mathematical analysis of data, such as addition, subtraction, multiplication, division, maximum, minimum, and correlation. The result is displayed in the form of a new visualization. In the Global Warming curriculum, students use WorldWatcher to create and visualize climate data, customize displays, and develop presentations.
The WorldWatcher Project currently supports a middle school and a high school curriculum initiative at LeTUS.org. Both curriculum projects integrate scientific visualization into an inquiry-based program of hands-on labs, group work, and discussions to enhance students' understanding of the scientific and social issues associated with our changing environment.