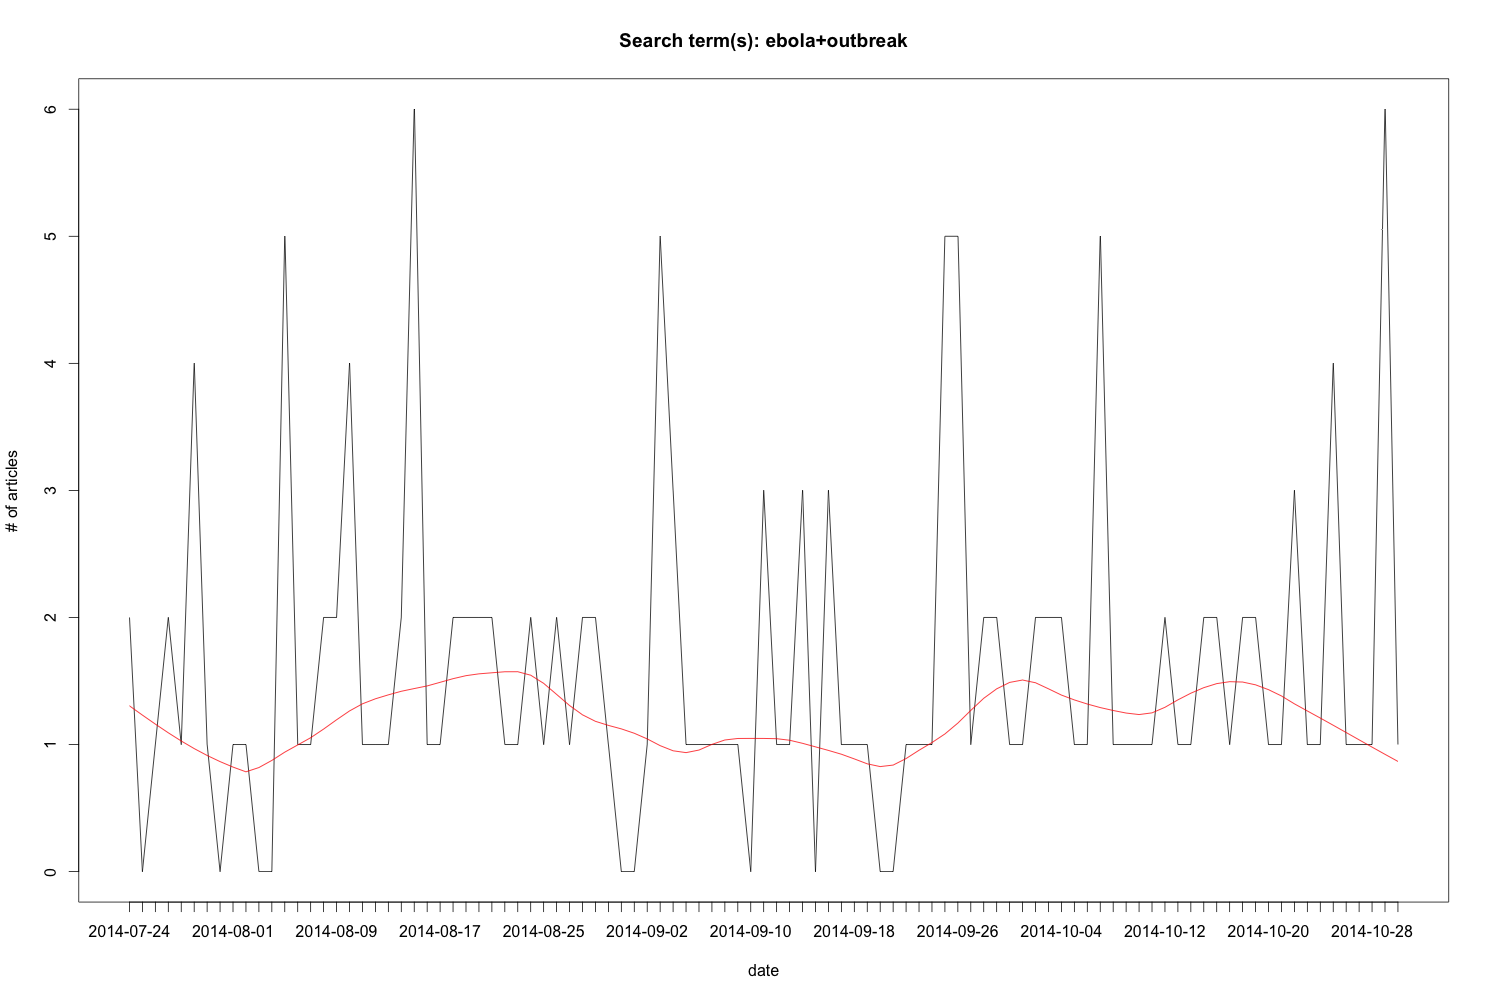
This is a quick and dirty attempt to make use of the NYT Article Search API from within R.
It retrieves the publishing dates of articles that contain a query string and plots the number of articles over time, like this:
To run the code below a (free) registration for an API key is required.
UPDATE 10/30/14:
This is a revised version which works with the new API2 released in July 2014. Many thanks to Clara Suong for suggesting the changes.
There is also an R package by Scott Chamberlain which works with the new API2.
[r]
library(RJSONIO)
library (RCurl)
### set parameters ###
api <- "XXXXXXXX" #<<<<<<<<<<<<<===== API key goes here
q <- "ebola+outbreak" # Query string, use + instead of space
records <- 500 #how many results do we want? (Note API limitations)
pageRange <- 0:(records/10-1)
# get data
dat <- c()
for (i in pageRange) {
# concatenate URL for each page
uri <- paste0("http://api.nytimes.com/svc/search/v2/articlesearch.json?q=", q, "&page=", i, "&fl=pub_date&api-key=", api)
d <- getURL(uri)
res <- fromJSON(d,simplify = FALSE)
dat <- append(dat, unlist(res$response$docs)) # convert the dates to a vector and append
}
# establish date range
dat.conv <- strptime(dat, format="%Y-%m-%d") # need to convert dat into POSIX format
daterange <- c(min(dat.conv), max(dat.conv))
dat.all <- seq(daterange[1], daterange[2], by="day") # all possible days
# aggregate counts for dates and coerce into a data frame
cts <- as.data.frame(table(dat))
# compare dates from counts dataframe with the whole data range
# assign 0 where there is no count, otherwise take count
# (take out PSD at the end to make it comparable)
dat.all <- strptime(dat.all, format="%Y-%m-%d")
# can't seem to be able to compare Posix objects with %in%, so coerce them to character for this:
freqs <- ifelse(as.character(dat.all) %in% as.character(strptime(cts$dat, format="%Y-%m-%d")), cts$Freq, 0)
plot (freqs, type="l", xaxt="n", main=paste("Search term(s):",q), ylab="# of articles", xlab="date")
axis(1, 1:length(freqs), dat.all)
lines(lowess(freqs, f=.2), col = 2)
[/r]
Download the R code here.
Terrific tutorial, but a few comments/questions:
Would you provide the source as a downloadable link? When copying/pasting from your example, the line numbers were included. There are also better blog plugins for displaying source code.
To get your example to run, I had to remove "amp;" from line 23. That wasn't present on line 15.
Is request throttling handled automatically by NYT? I ask because I thought I read somewhere that NYT submissions are limited to 2/sec.
Thanks for letting me know about that typo on line 23 -- fixed now.
Right now the way it works is not very intuitive, but if you switch to PLAIN TEXT (top of the box where the code is displayed) you get the original code without the line numbers. (Yes, I need to find some time to get a better plugin for displaying code and fix up a few other things also.)
I am afraid I don't know any details about their request throttling.
Ricardo Pietrobon suggested to try the above on Pubmed. Here is roughly how it might go.
Pubmed has an API, provided by NCBI. Details are here. So all we'd need to do is concatenate the appropriate URL string then parse the results in R. Results are in xml, so we'd need the XML library.
To map keywords by publication date (like in the NYT example) we need to submit two different queries:
1. For the first query we use the esearch utility to retrieve two important variables, WebEnv and QueryKey.
For the search term "h1n1" the URL needs to look like:
http://eutils.ncbi.nlm.nih.gov/entrez/eutils/esearch.fcgi?db=pubmed&retmax=0&term=h1n1&usehistory=y
#Read in:raw.data < - readLines("http://eutils.ncbi.nlm.nih.gov/entrez/eutils/esearch.fcgi?db=pubmed&retmax=0&term=h1n1&usehistory=y")
# Parse the result for WebEnv and QueryKey:library(XML)
parsed.data < - xmlTreeParse(raw.data) xmlValue(xmlChildren(xmlRoot(parsed.data))$QueryKey) xmlValue(xmlChildren(xmlRoot(parsed.data))$WebEnv)
2. For the second query we use the esummary utility to retrieve the actual records. So the URL, using WebEnv and QueryKey, from the previous query looks in my example looks like:
http://eutils.ncbi.nlm.nih.gov/entrez/eutils/esummary.fcgi?db=pubmed&retmode=xml&query_key=1&WebEnv=NCID_1_51824642_130.14.18.46_9001_1255542890
Now parse the result for PubDate.
For an example in php see here
I will make this a separate post once I get time to write out the details. Or maybe someone else will.
Hi Claudia,
Thank you for the interesting code. I tried unpacked the RJSONIO file folder into ..\R\win-library\2.10 but I get the following error:
Loading required package: RJSONIO
Error in library(package, lib.loc = lib.loc, character.only = TRUE, logical.return = TRUE, :
'RJSONIO' is not a valid installed packag
Any thought on why it's not working? The code works using the rjson package. What functionality is lost by not using RJSONIO? Also, how can we change the chart axis tick marks to highlight the dates returned by the API?
Thank you!!
Matt
Matt,
I don't have much experience on the Windows OS -- *maybe* RJSONIO is not compiled for 2.10 yet?? But this is really just a wild guess.
See here for difference between rjson and RJSONIO.
If you want to play with the tick marks layout you could take look at
axis.Claudia
Duncan Lang recently released a 0.1 version of a package called RNYTimes. It still lacks much documentation and I have not tried it, but it may make things easier.
Thank you, Claudia! I'll take a look at axis and the new RNYTimes packages.
Best regards,
Matt Bascom
RJSONIO is also available on the CRAN network, so downloading & installing it is now easier. Just type "install.packages("RJSONIO")" and R will find the package on the Web, download it to the right location and install it.
Dear Claudia,
Thank you so much for sharing this work. I stumbled into the throttling issue Neil asked about and found the answer on stack exchange. The NYTimes does not throttle requests for you. You have to add a pause or you will get a polite email telling you you've exceeded your QPS.
http://stackoverflow.com/questions/1174799/how-to-make-execution-pause-sleep-wait-for-x-seconds-in-r
PAUSE <- function(x)
{
p1 <- proc.time()
Sys.sleep(x)
proc.time() - p1 # The cpu usage should be negligible
}
PAUSE(1)
#(.1 will also work in your concatenation loop for 10 queries per second)
Thank you again. I really admire your work.
Sincerely,
-Liam Honecker
Lots of issues/errors when implementing this code. Is it possible to put up the source file you used to implement this code successfully ?