|
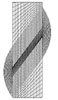
Figure 1A: Mesh for 2-D FE model of oblique
fracture.
|
|
|
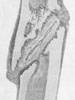
Figure 1B: Typical oblique pseudarthrosis (2).
|
|
|
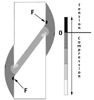
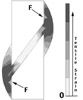
Figure 2A: Model I results for fracture callus -
Hydrostatic stress. Predicted areas of bone formation (F).
|
|
|
Figure 2B: Model I results for fracture callus -
Maximum tensile strain.
|
|
|
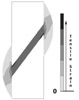
Figure 3A: Maximum tensile strain distribution for
Model II fracture callus.
|
|
|
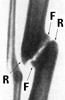
Figure 3B: X-ray of oblique pseudarthrosis (3) Areas
of bone formation (F) and resorption (R) at periosteal corners of fracture ends
(marked by authors) corresponding to locations of hydrostatic tension and high
hydrostatic pressure, respectively, in Models I and II.
|
|