Example 5.5
Du Fort-Frankel for the Heat Equation
Contents
Setup
close all;
N = 21;
L = 1;
alpha = 1;
dx = L/(N-1);
X = linspace(0,1,N)';
dt = 0.025;

% initial condition
T = sin(pi*X);
Spatial derivative operator
A = gallery('tridiag',N-2,1,-2,1);
inhomogeneous term
f = @(t) (pi^2-1)*exp(-t)*sin(pi*X(2:N-1));
Initial time advancement
Must solve the system

g = @(t,dt,T) (speye(N-2)-alpha*dt/2/(dx^2)*A)\(T(2:N-1)+ ...
    alpha*dt/2/(dx^2)*A*T(2:N-1) + dt*(f(t)+f(t+dt))/2);
Forward Euler
%g = @(t,dt,T) T(2:N-1) + dt*(alpha/dx/dx*A*T(2:N-1)+f(t));
Backward Euler
%g = @(t,dt,T) (speye(N-2)-alpha*dt/(dx^2)*A)\(T(2:N-1)+dt*f(t+dt));
Du Fort-Frankel time advancement
B = gallery('tridiag',N-2,1,0,1);
gamma = alpha/dx^2;
h = @(t,dt,T,prevT) (2*dt*gamma*B*T(2:N-1)+(1-2*dt*gamma)*prevT(2:N-1)+2*dt*f(t))/(1+2*dt*gamma);
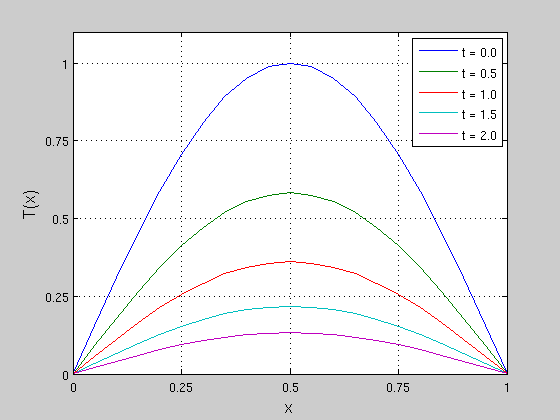
Accurate run
t_final = 2.0;        % final time
time = 0:dt:t_final;  % time array
pt = [0.0 0.5 1.0 1.5 2.0];   % desired plot times
pn = length(pt);          % number of desired plots
pc = 1;               % plot counter
rt = zeros(1,pn);
S = zeros(N,pn);      % solution storage

for t = time
    % plot storage
    if ( t >= pt(pc) )
        S(:,pc) = T;
        rt(pc) = t;
        pc = pc + 1;
        if (pc > pn)
            break
        end
    end

    % time advancement
    if ( t == 0.0 )
        prevT = T;
        T(2:N-1) = g(t,dt,T);
    else
        tempT = T;
        T(2:N-1) = h(t,dt,T,prevT);
        prevT = tempT;
    end
end
Plot accurate run
figure(1)
plot(X,S,'LineWidth',1)
xlabel('x','FontSize',14)
ylabel('T(x)','FontSize',14)
legend('t = 0.0','t = 0.5','t = 1.0','t = 1.5','t = 2.0')
axis([0 1 0 1.1])
ax = gca;
set(ax,'XTick',[0 .25 .5 .75 1])
set(ax,'YTick',[0 .25 .5 .75 1])
grid on
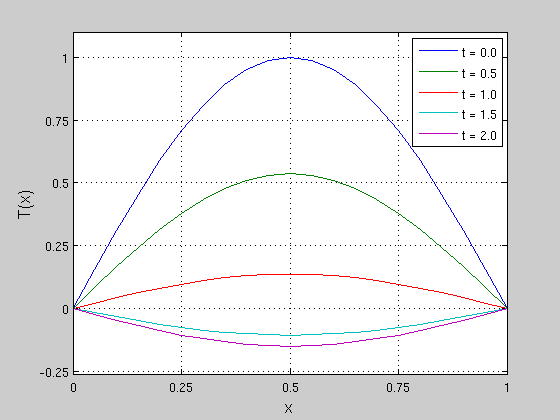
Inaccurate run
T = sin(pi*X);        % reset initial condition
dt = 0.1;             % time step
t_final = 2.0;        % final time
time = 0:dt:t_final;  % time array
pt = [0.0 0.5 1.0 1.5 2.0];   % desired plot times
pn = length(pt);          % number of desired plots
pc = 1;               % plot counter
rt = zeros(1,pn);
S = zeros(N,pn);      % solution storage

for t = time
    % plot storage
    if ( t >= pt(pc) )
        S(:,pc) = T;
        rt(pc) = t;
        pc = pc + 1;
        if (pc > pn)
            break
        end
    end

    % time advancement
    if ( t == 0.0 )
        prevT = T;
        T(2:N-1) = g(t,dt,T);
    else
        tempT = T;
        T(2:N-1) = h(t,dt,T,prevT);
        prevT = tempT;
    end
end
Plot inaccurate run
figure(2)
plot(X,S,'LineWidth',1)
xlabel('x','FontSize',14)
ylabel('T(x)','FontSize',14)
legend('t = 0.0','t = 0.5','t = 1.0','t = 1.5','t = 2.0')
axis([0 1 -.26 1.1])
ax = gca;
set(ax,'XTick',[0 .25 .5 .75 1])
set(ax,'YTick',[-.25 0 .25 .5 .75 1])
grid on