Digital Image Processing
Home
Class Information
Class Schedule
Handouts
Projects Win 2018/19
Projects Win 2017/18
Projects Aut 2016/17
Projects Aut 2015/16
Projects Spr 2014/15
Projects Spr 2013/14
Projects Win 2013/14
Projects Aut 2013/14
Projects Spr 2012/13
Projects Spr 2011/12
Projects Spr 2010/11
Projects Spr 2009/10
Projects Spr 2007/08
Projects Spr 2006/07
Projects Spr 2005/06
Projects Spr 2003/04
Projects Spr 2002/03
Test Images
MATLAB Tutorials
Android Tutorials
SCIEN
BIMI
Final Project for Spring 2005-2006
Visual Code Marker Detection
The project should be done individually or in groups of up to 3 people and should require about 50 hours per person. Each group will develop and implement their own algorithm to detect an unknown number of visual code markers in an image captured by a cell-phone camera.
INTRODUCTION
DOWNLOADS
INSTRUCTIONS
DEADLINES
PROJECT SUBMISSION
PROJECT GROUPS
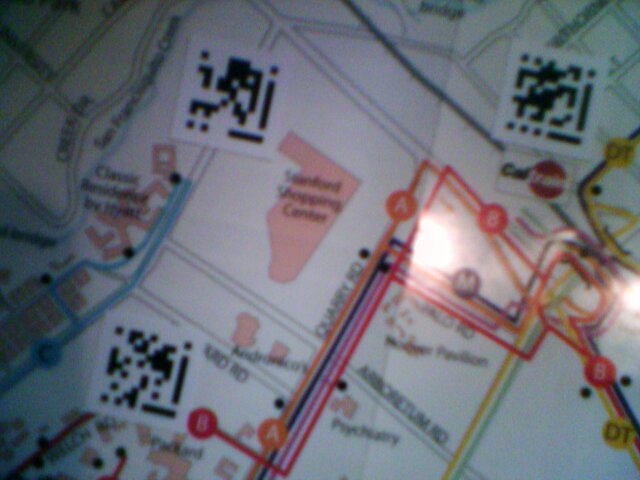
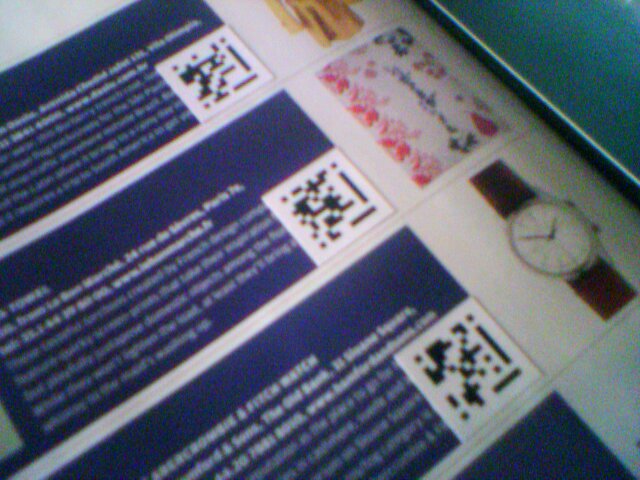
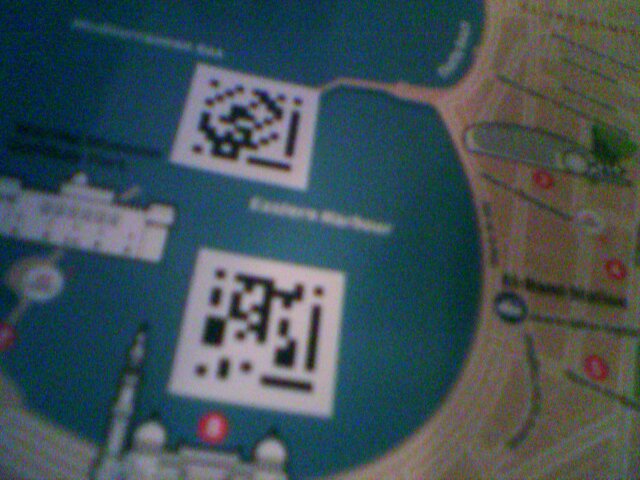
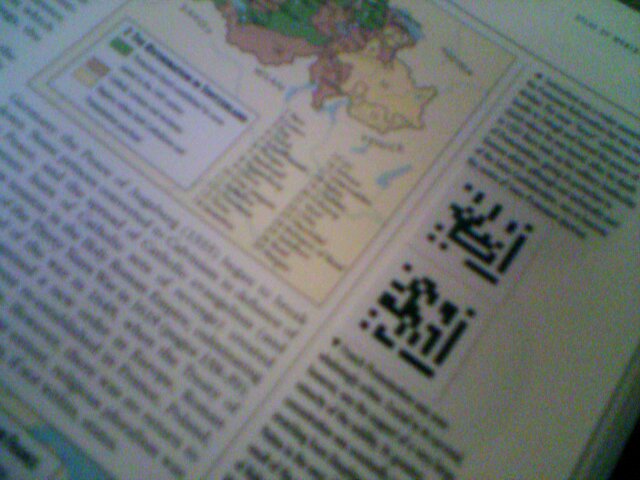
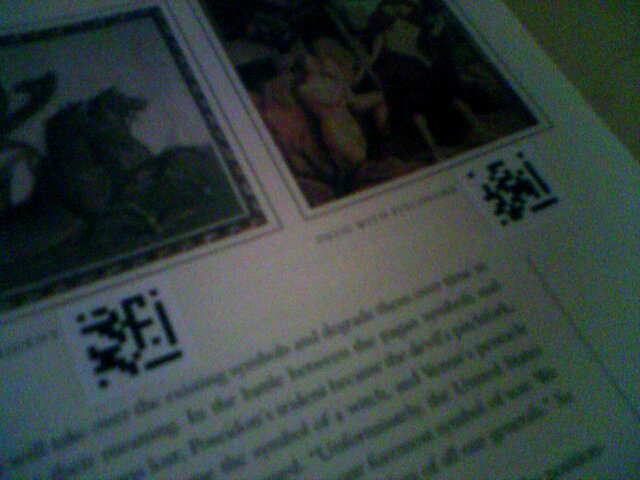
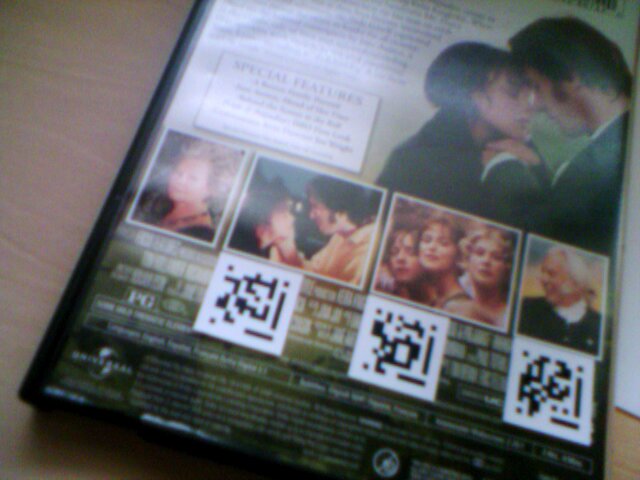
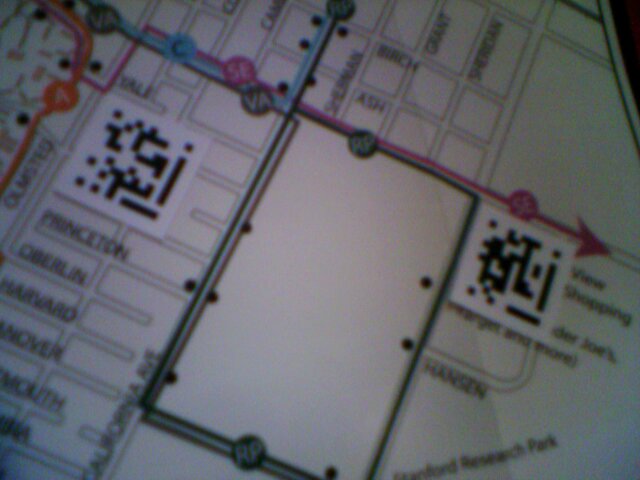
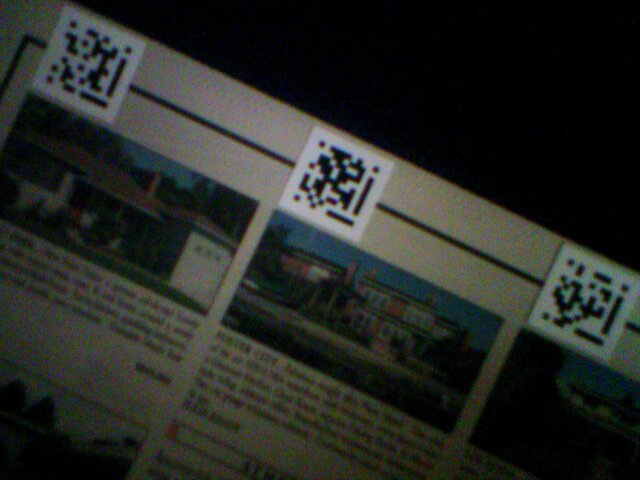
The project should be done individually or in groups of up to 3 people and should require about 50 hours per person. Each group will develop and implement their own algorithm. The task of the project is to detect and read visual code markers through the cell-phone camera. In the paper titled "Real-World Interaction with Camera-Phones", the author, Michael Rohs, describes the use of visual code markers in interacting with real-world objects. More information can be obtained by following this link. To give you an idea of the utility of visual code markers, the user could, for example, download the data embedded in the marker to his cell-phone, or follow a hyperlink embedded in the marker, or perform item-selection by rotating the camera-phone with respect to the marker, etc.
You will design and test your detection algorithm with a set of training images and the corresponding ground truth data that can be downloaded from the Downloads section. Once you submit your algorithm implementation, we will check its performance with a set of test images, which will be unknown to you while you work on your algorithm.
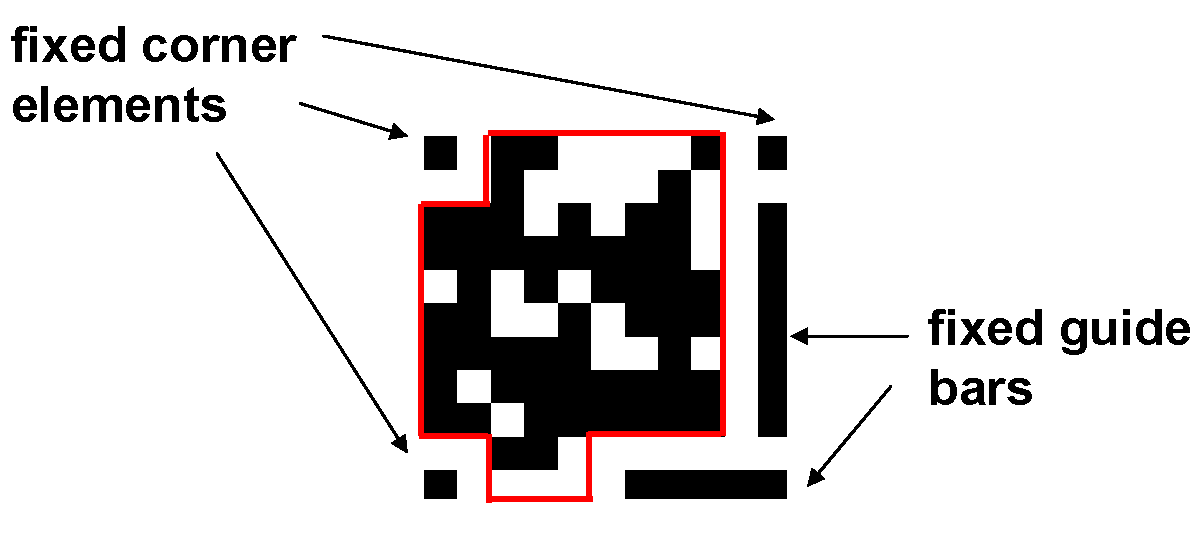
Visual Code Marker Details:
The visual code markers that we consider are 2-dimensional arrays. The array consists of 11x11 elements. Each element is either black or white. As shown in the figure below, we fix the elements in three of the corners to be black. One vertical guide bar (7 elements long) and one horizontal guide bar (5 elements long) are also included. The immediate neighbors of the corner elements and the guide bar elements are fixed to be white. This leaves us with 83 data elements which can be either black or white.
----------------------------------
Training Images and Ground Truth Data
Training_1.jpg Training_2.jpg Training_3.jpg Training_4.jpg
Training_5.jpg Training_6.jpg Training_7.jpg Training_8.jpg
Training_9.jpg Training_10.jpg Training_11.jpg Training_12.jpg
- The training images are regular JPEG images.
- The images can be read by imread( ) in MATLAB.
- The ground truth data are stored in the MATLAB data file called training_ground_truth.mat and can be read using load in MATLAB. The ground truth data consist of code marker data and position of upper left corner of the marker(s) in the given training images.
----------------------------------
Evaluation Program
This is the MATLAB function which will be used to evaluate your code marker reading algorithm. You should use it to evaluate the performance of your algorithm on the training images.
----------------------------------
Code Generation Program
This MATLAB function generates the code marker for a given input vector of 83 elements.
(1) Note that your detection algorithm has to output
- the number of markers detected in the image
- the coordinates for the upper left corner element of every marker detected in the image (specifically the coordinates of the center of the upper left element)
- the 83 data bits (1=black, 0=white) for every marker detected in the image
Specifically, the interface between your code detection function and the function evaluate( ) is specified in MATLAB notation as follows:
function [data_detected,origin_detected] = detect_code(img)
The input and output are defined as follows
img: height-by-width-by-3 uint8 array representing a 24-bit RGB image obtained through imread( ).data_detected: N-by-83 double array of 0's and 1's where N is the number of code markers detected. Each row of data_detected corresponds to the 83-bit data embedded in the code marker.
origin_detected: N-by-2 double array where N is the number of code markers detected. Each row of origin_detected corresponds to the [row,column] image-coordinate of the origin of a detected code marker. The origin of a code marker is defined as the top-left element of the marker, i.e., code(1,1) defined in generate_code.m.
(2) The performance metric (for a single input image):
Score = (number of correctly matched elements) - 41.5 x (number of repeats + number of false positives)
A detected code marker is matched for correctness with a ground truth code marker only if the Euclidean distance between the detected upper left corner and the ground-truth upper left corner is below a certain threshold. If multiple detected code markers are within this threshold, then the detected code marker with the least distance is selected. Note that any detected code marker will be matched with at most one ground-truth code marker and vice-versa.
False positive means a detected code marker which is outside the Euclidean distance threshold of any ground-truth code marker.
Repeat means a detected code marker which is within the Euclidean distance threshold of a ground-truth code marker in the image but there exists another detected code marker which is closer to the ground-truth code marker. The detected bits are discarded in this case.
False negative means a code marker that exists in the image but is not detected by the algorithm. Note that a false negative automatically reduces the score by reducing the number of correctly matched elements.
(3) Positive scores will be added for different test images. Negative scores will be counted as zero.
(4) The maximum run time for a single image is 1 minute. We will abort your program if it takes longer.
(5) While still in the training and optimization phase, you can create your own code markers using generate_code.m, paste them on real-world objects, capture images using your humble cell-phone camera, and use them to check your performance.
(6) To register your group, please send an e-mail to ee368-spr0506-staff@lists.stanford.edu with the subject "group registration for project".
Deadline to register groups: May 12.
Deadline for submission of project programs and report: midnight of June 2 (you have the whole day of June 2 to work on it), no extensions.
(1) Please mail to ee368-spr0506-staff@lists.stanford.edu (do not c.c. to TA's or Professor's personal e-mail address).
(2) For program, please include ONLY nessessary files in ONE ZIP file named "ee368groupXX.zip" and email it with subject "ee368 groupXX program". Your 2 digit group number XX is listed below.
(3) For report, please prepare in PDF format, name it "ee368groupXX.pdf" and email it with subject "ee368 groupXX report". Your 2 digit group number XX is listed below.
(4) Note that your code will be run on the SCIEN machines by the teaching staff. Hence, it is a good idea to get an account there and make sure that there are no platform-specific problems with your code.
(5) If you are a group, then you need to submit the log of who did what with your report.
2-member or 3-member groups:
01) Eric Chu, Erin Hsu, Sandy Yu. (project report)
02) Nandhini Nandiwada Santhanam, Alex Giladi. (project report)
03) Bradford Bonney, Evan Millar. (project report)
04) Joëlle Barral, Kristin Granlund, Ernesto Staroswiecki. (project report)
05) David Varodayan, Kunal Ghosh. (project report)
06) Emre Oto, Ahmet Altay. (project report)
07) Paul Reynolds, Bryan Brudevold, Paul Baumstarck. (project report)
08) Francisco Godoy, Johan Schonning. (project report)
09) Ryan Coutts, Jessica Faruque, Bragi Sveinsson. (project report)
10) Hattie Zhi Chen Dong, Perry Wang, George Yu. (project report)
11) Sanghui Ahn, Doe Hyun Yoon. (project report)
12) Daniel Blatnik, Abheek Banerjee. (project report)
13) Kiran Madhav, Kevin Gabayan, Itai Katz. (project report)
14) May Zhou, Yuki Konda, Kanako Hayashi. (project report)
15) Tao Xu, Chien-an Lai. (project report)
16) Taral Joglekar, Keya Pandia, Joel Darnauer. (project report)
17) Murat Aksoy, Tolga Cukur, Yusuf Ozuysal. (project report)
18) Prabhu Balasubramanian, Allen Huang. (project report)
19) Molina Gabriel David, Kim Edward Kido. (project report)
Individual:
20) Arayssi Sami. (project report)
21) Chen Jianrong. (project report)
22) Chen Chien-Yu. (project report)
23) Chen David Mo. (project report)
24) Diebel James Richard. (project report)
25) Dong Tina Teresa. (project report)
26) Downes Ian George. (project report)
27) Feinstein Oren. (project report)
28) Graham Andrew Blake. (project report)
29) Guerrero Molina Miguel Angel. (project report)
30) Ho An Binh Trong. (project report)
31) Keane Scott Patrick. (project report)
33) Limlamai Manit Michael. (project report)
34) Lin Albert. (project report)
35) Paulson Christine Nicole. (project report)
36) Percival Brian Mitchell. (project report)
37) Pond David Joe. (project report)
38) Rai Kapil. (project report)
39) Schuet Stefan Renko. (project report)
40) Sen Punyanjan. (project report)
41) Shultz Kimberly Merritt. (project report)
42) Song Ka Hye. (project report)
43) Steinbrenner Julie Elizabeth. (project report)
44) Takacs Gabriel. (project report)
45) Xu Qiang. (project report)
46) Yu Meng. (project report)
47) Zhang Jingshen Jimmy. (project report)
Test Images:
Test_1.jpg Test_2.jpg Test_3.jpg Test_4.jpg
Test_5.jpg Test_6.jpg Test_7.jpg Test_8.jpg
Test_9.jpg Test_10.jpg Test_11.jpg Test_12.jpg
Ground Truth Data for Test Images:
Updated evaluate function:
Histogram of scores:
project_histogram.pdf (each bin in the histogram is 100 points wide, maximum obtainable score is 1826, minimum possible score is 0.)
Please email ee368-spr0506-staff@lists.stanford.edu for questions or bug reports.
Last modified:
26/05/2006