Spring 2002
David Rogosa
rag@stanford.edu
http://www.stanford.edu/~rag/
First things first! Time and Day for Ed260X were incorrect in Axess listing prior to 3/30/02
(for unknown reasons SUSE staff chose not to enter the correct information).
Correct Listing (thanks to Kristina and Fred Spitz)
EDUC  260X  Popular Advanced Statistical Methods
McCull 117  Tue  2:15PM - 5:05PM  Rogosa,David R
SUSE Computing Lab in CERAS (as of 3/30/02)
LISREL and HLM are both installed in CERAS computer lab on the first three machines on your left as you enter. SAS in process of being added.
BALLAD OF THE CASUAL MODELER Lyrics
Music: Open RealPlayer 7 (or equivalent) to
http://www.stanford.edu/class/ed260/ballad.rm
http://www.stanford.edu/class/ed260/ballad.mp3
A partially knowledgable observer could describe this course by the buzz-words "LISREL and HLM" and that concise phrase is somewhat informative. A main objective is to take a serious look at some of these advanced (and heavily marketed) statistical procedures that have become widely used (for better or worse) in education and social science. The broader perspective is to start with the data analysis (and substantive) settings that these procedures purport to address (if not solve):
1. Analysis of Multilevel Data (e.g., kids within classrooms within schools)
2. Analyses seeking Causal Inferences from non-experimental data, often in terms of Latent Variables
The point being that there is much much much more to these important topics than what is covered by LISREL and HLM (programs or writings) and the challenge of organizing this course is to weave in the larger issues.
Scientific Software International http://www.ssicentral.com/home.htm
home of * Structural Equation Modeling (LISREL) * Hierarchical Linear Modeling (HLM) Student editions, documentation, examples, etc for both progrms
Centre for Multilevel Modelling (H Goldstein)
http://multilevel.ioe.ac.uk/index.html contains MLWin manual (pdf download), large reference list, and esp Multilevel Modelling Newsletters http://multilevel.ioe.ac.uk/publref/newsletters.html
Additional Multilevel links
http://www.lrz-muenchen.de/~wlm/wlmmule.htm#Literature http://www-personal.engin.umich.edu/~gibsong/
http://stat.gamma.rug.nl/snijders/multilevel.htm
NLME: Software for mixed-effects models
http://nlme.stat.wisc.edu/ (links to the Bates-Pinheiro text, tech reports, docs ) older user's guide at http://cm.bell-labs.com/cm/ms/departments/sia/project/nlme/UGuide.pdf
SAS PROC MIXED and NLMIXED
see SAS v8 docs on Ceras machines
Fitting Nonlinear Mixed Models with the New NLMIXED Procedure Russell D. Wolfinger, SAS Institute Inc.,
http://www.sas.com/rnd/app/papers/nlmixedsugi.pdf
Repeated Measures with Zeroes Kenneth N. Berk, Peter A. Lachenbruch, http://www.sas.com/rnd/app/papers/repeatedmeasures.pdf
or just go to www.sas.com and serach on NLMIXED and MIXED.
For example Comparing the SAS GLM and MIXED Procedures for Repeated Measures Russ Wolfinger and Ming Chang, http://www.sas.com/rnd/app/papers/mixedglm.pdf
Can PROC MIXED be used to fit Hierarchical Linear Models (HLMs)? http://www.sas.com/service/techsup/faq/stat_proc/mixeproc1516.html
SAS PROC CALIS
see SAS v8 docs on Ceras machines; also of interest:
http://www.sas.com/service/techsup/faq/stat_proc/caliproc883.html
http://www.sas.com/service/techsup/faq/stat_proc/caliproc884.html
Mplus, B Muthen
main page, including progran download Mplus http://statmodel.com
key paper: Beyond Sem: General Latent Variable Modeling Bengt O. Muthen http://statmodel.com/muthen1.pdf
Amos by James L. Arbuckle
http://www.smallwaters.com/amos/
Stanford Social Sciences Data Resources
Stanford Libraries have constructed a very impressive gateway--Social Sciences Data Service
Historical and Current references on Causality
http://www.vanderbilt.edu/quantmetheval/causality.htm
David Freedman on Social Science and Causal Inference
Aggregation, Multilevel Data
1.Title: Ecological inference and the ecological fallacy, Date: March 1999 http://www.stat.berkeley.edu/~census/549.pdf
2.Title: On "Solutions" to the Ecological Inference Problem: D. A. Freedman, S. P. Klein, M. Ostland and M. Roberts Date: April 1998 http://www.stat.berkeley.edu/~census/515.pdf
Causal Inference
1.Title: From Association to Causation: Some Remarks on the History of Statistics: David Freedman
Date: June 1998: http://www.stat.berkeley.edu/~census/521.pdf
2. Title: From association to causation via regression David A. Freedman Date: April 22, 1994
ps rendered at http://www.stanford.edu/class/ed260/408.pdf
3. Title: Are There Algorithms that Can Discover Causal Structure?: David Freedman and Paul Humphreys Date: May 1998: http://www.stat.berkeley.edu/~census/514.pdf
4.Title: On Specifying Graphical Models for Causation: David A. Freedman Date: June 2001
http://www.stat.berkeley.edu/~census/601.pdf
5. Title: The swine flu vaccine and Guillain-Barre syndrome D.A. Freedman and P.B. Stark: Feb 1999
http://www.stat.berkeley.edu/~census/546.pdf
6. Statistical Assumptions as Empirical Commitments Richard A. Berk David A. Freedman
http://www.stat.berkeley.edu/~census/berk2.pdf
7. Title: Salt and Blood Pressure: Conventional Wisdom Reconsidered: D. A. Freedman and D. B. Petitti April 2000
http://www.stat.berkeley.edu/~census/573.pdf
Some Rogosa Papers
Rogosa, D. R. (1987). Casual models do not support scientific conclusions: A comment in support of Freedman. Journal of Educational Statistics, 12, 185-195.
Rogosa, D. R. (1993). Individual unit models versus structural equations: Growth curve examples. In Statistical modeling and latent variables, K. Haagen, D. Bartholomew, and M. Diestler, Eds. Amsterdam: Elsevier North Holland, 259-281.
Rogosa, D. R., & Willett, J. B. (1985). Satisfying a simplex structure is simpler than it should be. Journal of Educational Statistics, 10, 99-107.
Rogosa, D. R. (1980). A critique of cross-lagged correlation. Psychological Bulletin, 88, 245-258.
Rogosa, D. R. (1985). Analysis of reciprocal effects. In International Encyclopedia of Education, T. Husen and N. Postlethwaite, Eds. London: Pergamon Press, 4221-4225.
Similar Courses
Paul Allison, U Penn, Sociology 611
Education 231E, Spring 2002 UCLA B. Muthen
http://www.gseis.ucla.edu/faculty/muthen/ED231e/index.html
SOCIOLOGY 529 Structural Equation Models for the Social Sciences U. Washington
http://www.soc.washington.edu/users/matsueda/529syll.pdf
"LISREL" Models: General Structural Equations ICPSR Doug Baer, U of Western Ontario
http://www.icpsr.umich.edu/TRAINING/Biblio95/baer.html
The Inter-university Consortium for Political and Social Research (ICPSR)
houses one of the largest archives of numeric data for social science research and is a popular source of numeric data for many researchers at Stanford. Begun in 1963, the ICPSR Summer Program in Quantitative Methods of Social Research offers a comprehensive, integrated program of studies in research design, statistics, data analysis, and social methodology. Basic methodological and technical training is offered, along with opportunities for advanced work in specialized areas. For online registration or more information about the ICPSR Summer Program in Quantitative Methods for Social Research: http://www.icpsr.umich.edu/TRAINING/summer.html
1. April 2. Because of chaos and misinformation on scheduling, the most I hope for is to assemble as many prospective students as possible and organize a real launch of the course next week. Organize, meet and greet, discuss student interests.
Current Event for discussion: TV watching, aggression linked in study of teens, young adults
some links: http://www.latimes.com/news/printedition/front/la-032902tv.story http://www.bayarea.com/mld/bayarea/news/nation/2959217.htm
http://news.bbc.co.uk/hi/english/entertainment/tv_and_radio/newsid_1899000/1899533.stm
through news.google.com I also found
http://www.washingtonpost.com/wp-dyn/articles/A53840-2002Apr2.html
http://canada.com/news/story.asp?id={102EB885-F812-4ABE-9DE7-C82F4D880185}
http://www.philly.com/mld/inquirer/news/front/2958547.htm
actual report and review in Science http://www.sciencemag.org/cgi/reprint/295/5564/2468.pdf
http://www.sciencemag.org/cgi/content/full/295/5564/2377
supplementary table for the TV-aggression article is: http://www.sciencemag.org/cgi/content/full/295/5564/2468/DC1
Data Adventure #1. Multilevel school data taken from the MlWin manual.
Data mlwinschool.dat contains 4059 rows (students) residing in 65 schools.
The sequence of the variables and the coding are as follows:
school: school identifiers
student: student identifiers
normexam: the exam score obtained by each student at age 16
cons: a column of 1's
standlrt: score for each student at age 11 on the London reading test
gender: student gender, 0=boy, 1=girl
schgend: school gender, 1=mix gender school, 2=boy school, 3=girl school
avslrt: coded as 1, 0, 1
schav: this variable is constructed by taking the average intake ability (standlrt) for each school. The bottom 25% of the schools are coded as 1=low, the middle 50% are coded as 2=mid, and the top 25% are coded as 3=high
vrband: coded as 1, 2, 3
Obtain within school regressions of normexam on standlrt (post on pre) and compare across schools. Any systematic differences for different schgend? Goldstein et al pose two substantive questions for these data under the heading of "Contextual effects"
Do girls learn more effectively in a girls' school or a mixed sex school? Do low ability pupils fare better when they are educated alongside higher ability pupils or worse?
Compare a multilevel analysis with an individual level analysis that ignores school membership.
2. April 9.
First full meeting: Orientation to course materials.
Discussion of TV violence and aggression articles. History and lecture on reciprocal effects.
Introduction to multilevel analyses.
Introduction to structural equation models.
3. April 16.
continue intro to multilevel analysis: example from HLM program
formal intro to path analysis and structural equation models (Allison notes)
discussion of Freedman papers on causal inference (From Association to Causation: Some Remarks on the History of Statistics; From association to causation via regression)
Data Adventure # 2 (From Paul Allison course notes)
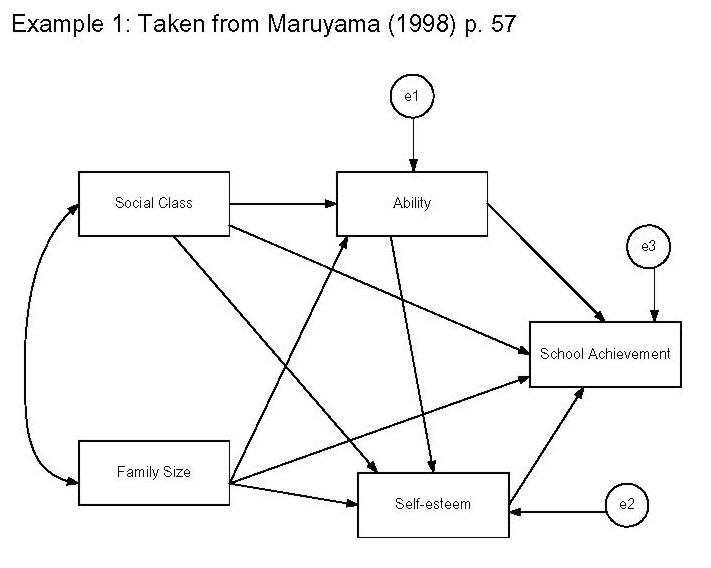
Correlation Matrix
class     1.00
famsize   -.33  1.00
ability    .39  -.33  1.00
esteem     .14  -.14   .19  1.00
achieve    .43  -.28   .67   .22  1.00
Do the indicated path analysis and interpret.
4. April 23.
Measurement error and multiple regression estimates (path anal)
Continue intro to structural equation models (Allison notes)
notation and estimation handout; Alienation example (Calis)
intro to multilevel analysis:
contextual effects examples; Aggregation bias, Duncan-Cuzzort-Duncan relation
examples from HLM program
discussion of Freedman papers on causal inference ( From association to causation via regression; Are There Algorithms that Can Discover Causal Structure?)
5. April 30.
a. Gina Kolata has provided another valuable guest lecture in the April 23 New York Times Science Section--
In Public Health, Definitive Data Can Be Elusive(NYT requires free reg; also acess sometimes expires after 7 days from pub date)
b. continue multilevel introduction--Kreft and DeLeuw examples from NELS data
c. Rogosa on causal modeling-- key readings (links above)
Rogosa, D. R. (1987). Casual models do not support scientific conclusions: A comment in support of Freedman. Journal of Educational Statistics, 12, 185-195.
Rogosa, D. R. (1993). Individual unit models versus structural equations: Growth curve examples.
Data Adventure # 3 (From SAS Proc Calis documentation, Joreskog papers)
Conduct the structural equation model analysis for these data and depicted model. If ambitious also look at the possibility of correlated erorrs in the manifest variables.
"Data Matrix of WHEATON, MUTHEN, ALWIN & SUMMERS (1977)";
label v1='Anomia (1967)' v2='Anomia (1971)' v3='Education' v4='Powerlessness (1967)' v5='Powerlessness (1971)' v6='Occupational Status Index';
   v1   11.834     .        .        .       .        .
   v2    6.947    9.364     .        .       .        .
   v3    6.819    5.091   12.532     .       .        .
   v4    4.783    5.028    7.495    9.986    .        .
   v5   -3.839   -3.889   -3.841   -3.625   9.610     .
   v6  -21.899  -18.831  -21.748  -18.775  35.522  450.288
6. May 7.
a. additional letters New York Times Science Section following In Public Health, Definitive Data Can Be Elusive(NYT requires free reg; also acess sometimes expires after 7 days from pub date)
b. continue multilevel introduction--more Kreft and DeLeuw examples from NELS data, Bryk&Raudenbush text, Allison Notes
c. Start/continue Rogosa on causal modeling-- key readings (links above)
Rogosa, D. R. (1987). Casual models do not support scientific conclusions: A comment in support of Freedman.
Rogosa, D. R. (1993). Individual unit models versus structural equations: Growth curve examples.
Rogosa, D. R., & Willett, J. B. (1985). Satisfying a simplex structure is simpler than it should be.
Data Adventure # 4
For the data in Adventure 1, use normexam as outcome and standirt (pretest) as precitor. Obtain directly the three regression slopes discussed in contextual analysis: total between-school, within-school pooled. Verify the Duncan-Cuzort-Duncan relationship. Verify the relations for what Kreft terms the contextual reegression model (Y on X, Xbar) and for the Cronbach model (Y on X-bar, X - Xbar).
Data Adventure # 5 (Nels data from Kreft text)
Data summaries for the 10 school example are given below. From these data summaries obtain the three regression slopes discussed in contextual analysis: total between-school, within-school pooled. Verify the Duncan-Cuzort-Duncan relationship.
Table 2.1 Ten selected schools from NELS-88: within-school means
School Size Math mean Homework mean
1       23     45.8      1.39
2       20     42.2      2.35
3       24     53.2      1.83
4       22     43.6      1.64
5       22     49.7      0.86
6       20     46.4      1.15
7.      67     62.8      3.30
8       21     49.6      2.10
9       21     46.3      1.33
10      20     47.8      1.60
Table 2.1 gives the mean math score (number correct) amounts of homework (in hours per week),
Table 2.2 Ten selected schools from NELS-88:within-school dispersions and correlations
School Dispersion Correlation
A         55.2 -4.24         -0.52
         -4.24 1.19
B         65.1 -4.65         -0.45
         -4.65 1.63
C         126.3 9.62          0.77
          9.62 1.22
D         94.1 11.9           0.84
          11.9 2.14 .
E         69.2 -2.71         -0.43
         -2.71 0.57
F         17.0 -1.56         -0.48
         -1.56 0.63
G         31.2 3.24           0.34
          3.24 2.92 .
H         101.1 7.94          0.71
           7.94 1.22 .
I         86.6 4.61           0.56
          4.61 0.79 .
J         120.9 12.3          0.80
          12.3 1.94 .
7. May 14.
a. this week's current event observational study: Breast-Feeding Linked to IQ Gain
Study Ties Adult Intelligence to Nutrition in Infancy Washington Post May 8, 2002;
b. continue multilevel HLM examples-- Bryk&Raudenbush text, Allison Notes,
Singer HLM/PROC Mixed papers: Multilevel Modelling Newsletter ; JEBS1998
Data Adventure # 6 HSB data from Bryk-Raundenbush, Singer
The High School and Beyond data set (HSB) is provided in the course directory.
The HSB data is used in the HLM book and manual in the two Singer papers and in the SSI HLM tutorial.
The level 1 (student file) is HSB1.dat and the level 2 (school file) is HSB2.dat
path: /usr/class/ed260/HSB*.dat or /afs/ir.stanford.edu/class/ed260/HSB*.dat
Level-1 file. For our example data the level-1 file has 7185 cases and four variables (not including the school ID).
In hsb1.dat the columns are School ID, minority (an indicator for student ethnicity 1 = minority, 0 = other)
female (an indicator for student gender 1 female, 0 = male), ses, (a standardized scale constructed from variables measur-ing parental education, occupation, and income)
mathach (a measure of mathematics achievement)
In hsb2.dat, which contains 160 schools with 6 variables per school, the columns are
School ID, size (school enrollment), sector (1 = Catholic, 0 = public), pracad (proportion of students in the academic track), disclim (a scale measuring disciplinary climate)
himnty (I = more than 40% minority enrollment, 0 = less than 40%),
meanses (mean of the SES values for the students in this school who are included in the level-i file; typical of the HLM guys these don't match exactly)
a. replicate the analysis using cSES as Level 1 predictor and SES, Sector as Level 2 predictors shown for example in Singer pp.336-338.
Use HLM or SAS Proc Mixed for computing.
b. try the "Minitab" equivalent (Minitab is a proxy for any simple regression program). Two separate approaches which can be compared.
First, fit 160 within-school regressions. Use intercept slope param estimates as outcome vars for Level 2 predictors
Second, fit one large regression model--eq 8b Singer p.337--to 7185 cases (substitute level 2 eqs into level 1 model for mathach)
Compare results from parts a and b.
8. May 21.
Current event: Individual and School level analyses, Progress of Charter School Students
a. Finish Rogosa on causal modeling--Stability, Simplex examples plus Reciprocal Effects (links above)
Rogosa, D. R. (1987). Casual models do not support scientific conclusions: A comment in support of Freedman.
Rogosa, D. R. (1993). Individual unit models versus structural equations: Growth curve examples.
Rogosa, D. R., & Willett, J. B. (1985). Satisfying a simplex structure is simpler than it should be.
Rogosa, D. R. (1980). A critique of cross-lagged correlation. Psychological Bulletin, 88, 245-258
Also Beyond Sem: General Latent Variable Modeling Bengt O. Muthen http://statmodel.com/muthen1.pdf
Breckler, S. J. (1990). Applications of Covariance Structure Modeling in Psychology: Cause for Concern?
Psychological Bulletin, 107, 260-273.
NOTE: this link takes you to Stanford Coursework site. You will have to register for Ed260X. I worked hard to set this up, please avail yourself
Update 5/22: the link realy does work, even from my windows machine at home, Netscape 6 no javascript
Data Adventure # 7 Rogosa 3-wave longitudinal examples
Use the data available at http://www.stanford.edu/~rag/Myths/lisrel.dat (Xi indicates perfect measurement X fallible measurement) to verify the results for the
path analysis coefficients (diagram Fig 3 and eq 3 of Individual unit models or Eq 2 Casual models) given in Eq 4 Individual unit models or Eq 3 Casual models
for perfect measurement. Compute coefficients and R-square for both Xi and X regressions
Data Adventure # 8 Rogosa, 5-wave simplex model analysis examples
Use the 5x5 covariance (or correlation) matrix in the simplex paper (or better yet create your own) and use LISREL or Calis etc to fit
the simplex model shown in the simplex paper. Complete LISREL specification given in Appendix. Pay special attention to any
interesting fit or model modification statistics (as in student presentation).
9. May 28.
Current event: Stress and Heart Disease
We really don't have time for more current event examples but this one is too good to ignore. Large observational study in British Medical Journal declares:
"We did not find any causal link between stress and heart disease," pdf here
SUSE relevance: a large part of the Counseling Psych program has been devoted to belief in the importance of stress.
If we can't even pin down the relation of stress and serious medical outcome, what is the sense of trying to investigate the effects of self-esteem and the like--especially
by naming some variables, drawing circles around them to indicate they are latent, and then drawing in some arrows to tell the computer what to do with the covariance matrix.
Pretty hard not to laugh?
a. Nonlinear multilevel (HLM) examples-- HLM program documentation; SAS NLMIXED, Splus NLME
Binonmial, Bernoulli examples
Fitting Nonlinear Mixed Models with the New NLMIXED Procedure Russell D. Wolfinger, SAS Institute Inc.,
http://www.sas.com/rnd/app/papers/nlmixedsugi.pdf
Examples of level-2 nonlinear models (HGLM) at: http://www.ssicentral.com/hlm/example.htm
Repeated Measures with Zeroes Kenneth N. Berk, Peter A. Lachenbruch, http://www.sas.com/rnd/app/papers/repeatedmeasures.pdf
Survival analysis examples: MLwiN Macros for advanced Multilevel modelling Ch.2
b. Holland-Rubin models for comparative experiments (causal inference)
Causal Inference, Path Analysis, and Recursive Structural Equations Models Paul W. Holland Sociological Methodology, Vol. 18. (1988), pp. 449-484.
Abstract Rubin's model for causal inference in experiments and observational studies is enlarged to analyze the problem of "causes causing causes" and is compared to
path analysis and recursive structural equations models. A special quasi-experimental design, the encouragement design, is used to give concreteness to the discussion by
focusing on the simplest problem that involves both direct and indirect causation. It is shown that Rubin's model extends easily to this situation and specifies conditions
under which the parameters of path analysis and recursive structural equations models have causal interpretations.
NOTE: this is a JSTOR link so it requires you to be on a Stanford IP machine (i.e. campus or campus dial-up)
Related technical reading Statistics and Causal Inference, Paul W. Holland pp. 945-960 JASA 1986, another JSTOR link
Commentaries Donald Rubin, David Cox
Data Adventure #9. Bernoulli outcome data taken from the MlWin manual. Data mlwinsbrit.dat . These data come from the longitudinal component of
the British Election Study (see Heath et al. 1996). It consists of a subsample of 800 voters grouped within 110 voting constituencies who were asked how
they voted in the 1983 British general election. For our purposes the responses are classified simply as to whether or not they voted Conservative.
The variables are defined as follows (columns in the dataset):
Voter is the identification of each individual voter.
Area identifies the constituency they voted in.
Defence is a 21 point scale of attitudes towards nuclear weapons, with low scores indicating respondents were against Britain possessing them. The variable is centred about its mean value.
Unemp is a 21 point scale of attitudes towards unemployment, with low scores indicating strong opposition and high scores a preference for more unemployment if it leads to
lower inflation. The variable is centred about its mean value.
Taxes is a 21 point scale of attitudes towards tax cuts, with low scores indicating a preference for higher taxes to pay for more government spending.
The variable is centred around its mean value.
Privat is a 21 point scale of attitudes towards privatisation of public services, with low scores indicating opposition. The variable is centred around its
mean value.
Votecons is 1 if the respondent voted Conservative and 0 otherwise.
The individual level outcome is votecons. Try out some multilevel prediction models for Votecons.
10. June 4, Dead Week meeting.
Course recap
remaining student reports
Final Problems. Assignment available here Due in Rogosa's Sequoia Hall mailbox 3 PM Friday June 14 (graduating students due 5PM Tues 6/11).
Causal Inference, Structural Equation Models
Alwin, D. F. (1988). Structural equation models in research on human development and aging. In K. W. Schaie, R. T. Campbell, W. M. Meredith, & S. M. Rawlings (Eds.), Methodological issues in aging research (pp. 71-170). New York: Springer Publishing Co.
Breckler, S. J. (1990). Applications of Covariance Structure Modeling in Psychology: Cause for Concern? Psychological Bulletin, 107, 260-273.
David Freedman. From Association to Causation: Some Remarks on the History of Statistics
David Freedman and Paul Humphreys. Are There Algorithms that Can Discover Causal Structure?
Holland, P. W. (1988). Causal inference, path analysis and recursive structural equation models. In C. Clogg (Ed.), Sociological Methodology 1988 (pp. 449-484). Washington, D.C.: ASA
Joreskog, K. & Sorbom, D. (1979). Advances in Factor Analysis and Structural Equations Models. Cambridge MA: ABT Books.
Rogosa, D. R., & Willett, J. B. (1985). Satisfying a simplex structure is simpler than it should be. Journal of Educational Statistics, 10, 99-107.
Rogosa, D. R. (1987). Casual models do not support scientific conclusions: A comment in support of Freedman. Journal of Educational Statistics, 12, 185-195.
Rogosa, D. R. (1993). Individual unit models versus structural equations: Growth curve examples. In Statistical modeling and latent variables, K. Haagen, D. Bartholomew, and M. Diestler, Eds. Amsterdam: Elsevier North Holland, 259-281.
Rogosa, D. R. (1995). Myths and methods: "Myths about longitudinal research," plus supplemental questions. In The analysis of change, J. M. Gottman, Ed. Hillsdale, New Jersey: Lawrence Erlbaum Associates, 3-65.
Rogosa, D. R. (1979). Causal models in longitudinal research: Rationale, formulation, and interpretation. In Longitudinal methodology in the study of behavior and development, J. R. Nesselroade and P. B. Baltes, Eds. New York: Academic Press, 263-302.
Werts C.E Linn, R. L. and Joreskog (1977). A simplex model for analyzing academic growth. Educational and Psychological Measurement, 37, 745-756.
multilevel/hierarchical data, aggregation, HLM
Burstein, Leigh. (1980) Issues in the Aggregation of Data. Review of Research in Education, 8, 158-236.
Bryk, A.S. & Raudenbush, S. W. (1987). Application of hierarchical linear models to assessing change. Psychological Bulletin, 101, 147-58
Bryk, A.S. & Raudenbush, S. W.(1992). Hierarchical linear models: Applications and data analysis methods. Sage Publications:CA:Lnd.
Bryk, A.S, Raudenbush, S.W, Seltzer,M. Congdon,R.T (1989) An Introduction to HLM: Computer Program and User's guide.
D. A. Freedman S. P. Klein M. Ostland M. Roberts. On "Solutions" to the Ecological Inference Problem 10 June 1998 Technical Report No. 515 Statistics Department UC Berkeley
David A. Freedman. Ecological inference and the ecological fallacy
Harvey Goldstein (1995). Multilevel Statistical Models.
Kreft, I.G., de Leeuw J., & Kim, K.S. (1990). Comparing Four Different Statistical Packages for Hierarchical Linear Regression: Genmod, HLM, ML2, and VARCL. CSE Technical Report 311, UCLA Center for Research on Evaluation, Standards, and Student Testing.
Rogosa, D. R., and Saner, H. M. (1995). Longitudinal data analysis examples with random coefficient models. Journal of Educational and Behavioral Statistics, 20, 149-170.
Rogosa, D. R., and Saner, H. M. (1995). Reply to Discussants: Longitudinal data analysis examples with random coefficient models. Journal of Educational and Behavioral Statistics, 20, 234-238.
Judith D. Singer. Fitting multilevel models using SAS PROC MIXED
MULTILEVEL MODELLING NEWSLETTER Mathematical Sciences
Institute of Education, University of London
Singer, J. D. (1998). Using SAS PROC MIXED to fit multilevel models, hierarchical models, and individual growth models. Journal of Educational and Behavioral Statistics.