Announcements
- Midterm in 1.5 weeks in STLC 115
- We don't maintain the course readings (specifically, today's readings do not match)
Plan for Today
- Over the past few weeks, we've been using JavaScript to learn about code.
- Now, we will apply many programming concepts to spreadsheets, using computers to manipulate text-based data.
- Goal for today: learn how to manipulate and process data in Google Sheets to extract conclusions.
Spreadsheets: Logistics
- Using Google Sheets
- All our in-class spreadsheets can be viewed here in a Google Drive.
- Note: to edit files, you can make a copy through the file dropdown on the top menu
Spreadsheets: An Introduction
- Used to store textual information (as opposed to images)
- Links information together in rows and columns
- Generally, rows combine to give multiple pieces of information about one object (e.g. Marvel Characters).
- Columns give the same piece of information for every object.
Variables in Spreadsheets
- Each cell (intersection of a row/column) is a variable
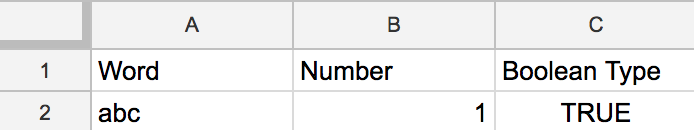
- There are three "types" of variables
- Text (words): left-justified
- "Boolean" values (true and false): center-justified
- Numbers (percents, decimals, and monetary amounts): right-justified
- Experiment: are the numbers always perfectly accurate? What happens if you type a really big number and subtract it from a number one bigger than it?
Our Datasets
- Marvel Comics
- Source: FiveThirtyEight
- Chocolate
- Source: Kaggle
Data Layout in Spreadsheets
- Rows = objects (samples in data)
- Each row has multiple pieces of information
- Column = fields
- "properties" of the row
- Labelled with a header (should freeze the headers)
Functions
- Recall: JavaScript functions
print(image);image.getPixel(x, y);
- Way of manipulating data
FUNCTION_NAME(arg1, arg2,...)- Almost always used on columns
- Exercise: How many appearances of comic book characters have there been total?
Functions behind the scenes
- Look at every row of data
- Perform the calculation on that row of data
- Just like a for loop!
If statements
IF(test, true case, false case)- Automatically includes an if and an else
- Note: use
=instead of== - Exercise: Let's make a new column that is true if the character is female and introduced before 2000.
Useful functions
COUNTUNIQUE(range)UNIQUE(range)SUM(range)COUNTIFS(condition_range, condition)SUMIFS(range, condition_range, condition)MINIFS(range, condition_range, condition)MAXIFS(range, condition_range, condition)ISBLANK(cell/range)- To search for non-empty cells, use the condition
"<>" - Note: for any of the "ifs", can add a condition (like an "and") with another pair:
COUNTIFS(condition1_range, condition1, condition2_range, condition2)- Can Google any of these functions + "Google Sheets" to find examples
Useful Pattern
- A common pattern is to try to separate the data by category, then use an IFS function on every category.
- First, use the UNIQUE function to find the categories.
- Use the IFS function on every category in UNIQUE.
- Example: Which ID has the most number of appearances?
Exercises
- How many characters have a non-empty GSM column?
- What is the average number of appearances for a male comic book character? What about a female character? What about any character whose GSM column is not empty?
- Are male characters more likely to be heroes or villains? What about female characters?
- What is the most popular ID (by number of characters with that ID)?
- Which alignment of character is most likely to die?
- What else can you find out?
Recap
Today, we saw how computers can store and manipulate data in spreadsheets using the same coding principles from JavaScript and images. Next week, we'll talk about Artificial Intelligence.